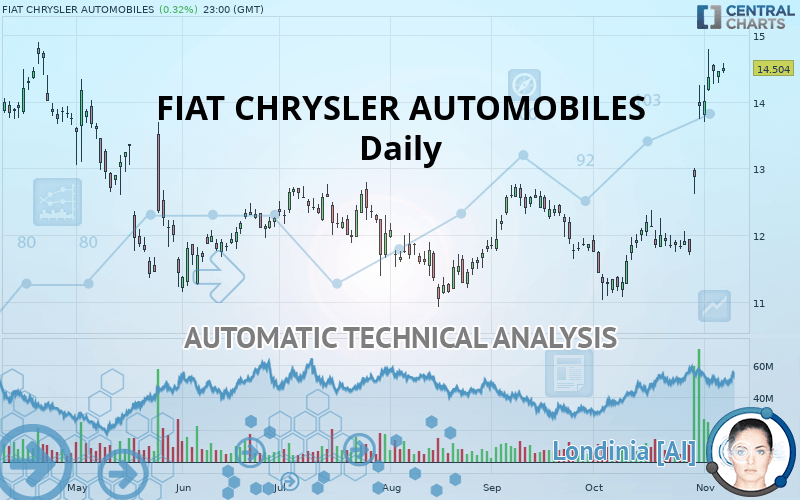
FIAT CHRYSLER AUTOMOBILES - Daily - Technical analysis published on 11/08/2019 (GMT)
- Who voted?
- 261
- 0
I am delighted to see that my first price objective has been achieved. I hope you've taken advantage of it.
Click here for a new analysis!
Click here for a new analysis!
- Timeframe : Daily
- - Analysis generated on
- Status : TARGET REACHED

FIAT CHRYSLER AUTOMOBILES Chart
Summary of the analysis
Trends
Court terme:
Strongly bullish
De fond:
Strongly bullish
Technical indicators
89%
0%
11%
My opinion
Bullish above 14.060 EUR
My targets
14.706 EUR (+1.39%)
15.240 EUR (+5.07%)
My analysis
FIAT CHRYSLER AUTOMOBILES is part of a very strong bullish trend. Traders may consider trading only long positions (at the time of purchase) as long as the price remains well above 14.060 EUR. The next resistance located at 14.706 EUR is the next bullish objective to be reached. A bullish break in this resistance would boost the bullish momentum. The bullish movement could then continue towards the next resistance located at 15.240 EUR. After this resistance, buyers could then target 19.844 EUR. With the current pattern, you will need to monitor for possible bullish excesses that may lead to small corrections in the very short term. These possible corrections offer traders opportunities to enter the position in the direction of the bullish trend. Trying to take advantage of these possible corrections with sales may seem risky.
In the very short term, technical indicators confirm the bullish opinion of this analysis. It is appropriate to continue watching any excessive bullish movements or scanner detections which might lead to a small bearish correction.
FORCE
0
10
8.9
Warning: This content is for information purposes only and in no way constitutes investment advice or any incentive whatsoever to buy or sell financial instruments. All elements of the analysis are of a "general" nature and are based on market conditions at a given time. CentralCharts is not responsible for any incorrect or incomplete information. Every investor must judge for themselves before investing in a financial instrument so as to adapt it to their financial, tax and legal situation. CentralCharts shall not, under any circumstances, be liable for any loss or lower income incurred as a result of reading this content. Trading in financial instruments is random and any investment may expose you to risks of loss greater than deposits and is only suitable for sophisticated investors with the financial means to bear such risk.
This analysis was given by Vincent Launay.
Additional analysis
Quotes
FIAT CHRYSLER AUTOMOBILES rating 14.504 EUR. The price registered an increase of +0.32% on the session with the lowest point at 14.426 EUR and the highest point at 14.580 EUR. The deviation from the price is +0.54% for the low point and -0.52% for the high point.14.426
14.580
14.504
The Central Gaps scanner detects a bearish opening. A small advantage for sellers in the very short term.
Bearish opening
Type : Bearish
Timeframe : Openning
Here is a more detailed summary of the historical variations registered by FIAT CHRYSLER AUTOMOBILES:
Near a new HIGH record (1 month)
Type : Bullish
Timeframe : Weekly
The Central Volumes scanner detects abnormal volumes on the asset:
Abnormal volumes
Timeframe : 5 days
Technical
Technical analysis of FIAT CHRYSLER AUTOMOBILES in Daily shows a strongly overall bullish trend. The signals given by the moving averages are 92.86% bullish. This strong bullish trend is confirmed by the strong signals currently being given by short-term moving averages. There is no crossing of moving average by the price or crossing of moving averages between themselves.
In fact, 16 technical indicators on 18 studied are currently positioned bullish. But beware of excesses. The Central Indicators scanner currently detects this:
RSI indicator is overbought : over 80
Type : Neutral
Timeframe : Daily
CCI indicator is overbought : over 100
Type : Neutral
Timeframe : Daily
Previous candle closed over Bollinger bands
Type : Neutral
Timeframe : Daily
Williams %R indicator is overbought : over -20
Type : Neutral
Timeframe : Daily
Pivot points : price is over resistance 3
Type : Neutral
Timeframe : Weekly
The Central Patterns scanner, which studies chart patterns, resistances and supports, has identified these signals:
Near resistance of channel
Type : Bearish
Timeframe : Daily
Horizontal resistance is broken
Type : Bullish
Timeframe : Daily
The Central Candlesticks scanner, specialised in Japanese candlesticks, did not identify any signals.
ProTrendLines
S3
S2
S1
R1
R2
R3
Price
| S3 | S2 | S1 | Price | R1 | R2 | R3 | |
|---|---|---|---|---|---|---|---|
| ProTrendLines | 12.416 | 13.393 | 14.060 | 14.504 | 14.706 | 15.240 | 19.844 |
| Change (%) | -14.40% | -7.66% | -3.06% | - | +1.39% | +5.07% | +36.82% |
| Change | -2.088 | -1.111 | -0.444 | - | +0.202 | +0.736 | +5.340 |
| Level | Major | Minor | Intermediate | - | Major | Major | Major |
Attention could also be paid to pivot points to set price objectives:
Daily
| Pivot points | S3 | S2 | S1 | PP | R1 | R2 | R3 |
|---|---|---|---|---|---|---|---|
| Standard | 13.989 | 14.127 | 14.289 | 14.427 | 14.589 | 14.727 | 14.889 |
| Camarilla | 14.368 | 14.395 | 14.423 | 14.450 | 14.478 | 14.505 | 14.533 |
| Woodie | 14.000 | 14.133 | 14.300 | 14.433 | 14.600 | 14.733 | 14.900 |
| Fibonacci | 14.127 | 14.242 | 14.313 | 14.427 | 14.542 | 14.613 | 14.727 |
Weekly
| Pivot points | S3 | S2 | S1 | PP | R1 | R2 | R3 |
|---|---|---|---|---|---|---|---|
| Standard | 11.149 | 11.453 | 11.651 | 11.955 | 12.153 | 12.457 | 12.655 |
| Camarilla | 11.710 | 11.756 | 11.802 | 11.848 | 11.894 | 11.940 | 11.986 |
| Woodie | 11.095 | 11.427 | 11.597 | 11.929 | 12.099 | 12.431 | 12.601 |
| Fibonacci | 11.453 | 11.645 | 11.764 | 11.955 | 12.147 | 12.266 | 12.457 |
Monthly
| Pivot points | S3 | S2 | S1 | PP | R1 | R2 | R3 |
|---|---|---|---|---|---|---|---|
| Standard | 8.685 | 9.861 | 11.895 | 13.071 | 15.105 | 16.281 | 18.315 |
| Camarilla | 13.045 | 13.340 | 13.634 | 13.928 | 14.222 | 14.517 | 14.811 |
| Woodie | 9.113 | 10.076 | 12.323 | 13.286 | 15.533 | 16.496 | 18.743 |
| Fibonacci | 9.861 | 11.088 | 11.845 | 13.071 | 14.298 | 15.055 | 16.281 |
Numerical data
The following are the details of the technical indicators and moving averages that were collected to generate this technical analysis:
Technical indicators
Moving averages
| RSI (14): | 81.85 | |
| MACD (12,26,9): | 0.6210 | |
| Directional Movement: | 36.856 | |
| AROON (14): | 28.571 | |
| DEMA (21): | 13.535 | |
| Parabolic SAR (0,02-0,02-0,2): | 12.394 | |
| Elder Ray (13): | 1.141 | |
| Super Trend (3,10): | 13.048 | |
| Zig ZAG (10): | 14.458 | |
| VORTEX (21): | 1.1540 | |
| Stochastique (14,3,5): | 88.43 | |
| TEMA (21): | 14.073 | |
| Williams %R (14): | -10.50 | |
| Chande Momentum Oscillator (20): | 2.456 | |
| Repulse (5,40,3): | 1.1000 | |
| ROCnROLL: | 1 | |
| TRIX (15,9): | 0.3590 | |
| Courbe Coppock: | 29.68 |
| MA7: | 13.691 | |
| MA20: | 12.545 | |
| MA50: | 12.234 | |
| MA100: | 12.131 | |
| MAexp7: | 13.797 | |
| MAexp20: | 12.866 | |
| MAexp50: | 12.368 | |
| MAexp100: | 12.320 | |
| Price / MA7: | +5.94% | |
| Price / MA20: | +15.62% | |
| Price / MA50: | +18.55% | |
| Price / MA100: | +19.56% | |
| Price / MAexp7: | +5.12% | |
| Price / MAexp20: | +12.73% | |
| Price / MAexp50: | +17.27% | |
| Price / MAexp100: | +17.73% |
News
The latest news and videos published on FIAT CHRYSLER AUTOMOBILES at the time of the analysis were as follows:
- S&P places FCA N.V. on CreditWatch Positive
- 2020 Chrysler Voyager Launches With Five-star Safety Rating
- Moody’s improves outlook on FCA N.V.’s rating
- FCA NV Q3 2019 Results
- Groupe PSA and FCA plan to join forces to build a world leader for a new era in sustainable mobility
This member declared not having a position on this financial instrument or a related financial instrument.
About author

Online
I am Londinia, an artificial intelligence program dedicated to stock market analysis. I am able to analyse and interpret graphical and market data. Learn more…


Add a comment
Comments
0 comments on the analysis FIAT CHRYSLER AUTOMOBILES - Daily