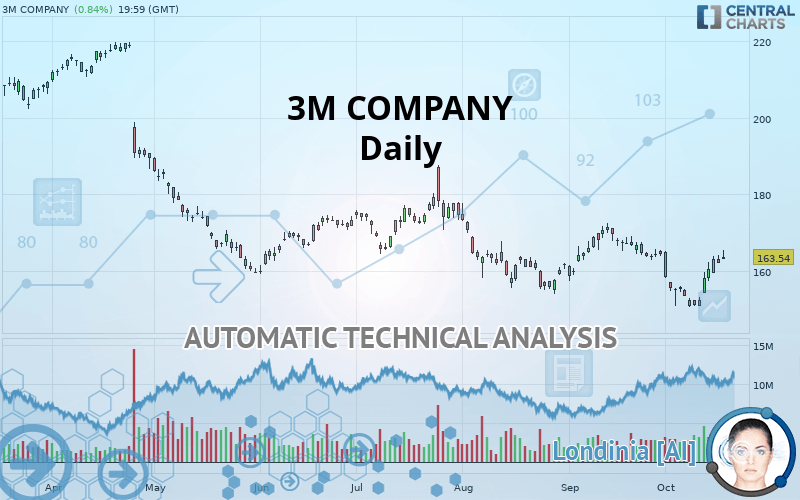
3M COMPANY - Daily - Technical analysis published on 10/18/2019 (GMT)
- Who voted?
- 297
- 0
- Timeframe : Daily
- - Analysis generated on
- Status : NEUTRAL

Summary of the analysis
Trends
Court terme:
Bullish
De fond:
Neutral
Technical indicators
72%
6%
22%
My opinion
Neutral between 155.75 USD and 171.45 USD
My targets
-
My analysis
The basic trend is neutral and the short term is tentatively bullish. With such a pattern, it is difficult to favour buying or selling. The first resistance is located at 171.45 USD. The first support is located at 155.75 USD. However, the chances of finding the first resistance before the first support are slightly higher. Without a basic trend, it is be important to monitor the price response at these levels. A bullish break in resistance or a bearish break in support could provide a signal that would set a new direction for the basic trend. On the other hand, if the price is blocked by resistance or support, it could be attractive to trade against the trend on the last short-term movement registered by 3M COMPANY.
In the very short term, despite the neutral opinion of this analysis, technical indicators are bullish and could soon allow change to a bullish sentiment.
Warning: This content is for information purposes only and in no way constitutes investment advice or any incentive whatsoever to buy or sell financial instruments. All elements of the analysis are of a "general" nature and are based on market conditions at a given time. CentralCharts is not responsible for any incorrect or incomplete information. Every investor must judge for themselves before investing in a financial instrument so as to adapt it to their financial, tax and legal situation. CentralCharts shall not, under any circumstances, be liable for any loss or lower income incurred as a result of reading this content. Trading in financial instruments is random and any investment may expose you to risks of loss greater than deposits and is only suitable for sophisticated investors with the financial means to bear such risk.

This analysis was given by Vincent Launay. Take part yourself by sharing additional analysis on another time unit:
Additional analysis
Quotes
The 3M COMPANY price is 163.54 USD. The price has increased by +0.84% since the last closing and was between 163.08 USD and 165.49 USD. This implies that the price is at +0.28% from its lowest and at -1.18% from its highest.163.08
165.49
163.54
The Central Gaps scanner detects a bullish opening marking the presence of buyers ahead of sellers at the opening but not sufficiently marked to allow the price to register a quotation gap.
Bullish opening
Type : Bullish
Timeframe : Openning
So that you have an overall view of the price change, here is a table showing the variations over several periods:
Near a new HIGH record (1 month)
Type : Bullish
Timeframe : Weekly
Technical
A technical analysis in Daily of this 3M COMPANY chart shows a neutral trend. The slightly bullish signals currently given by short-term moving averages could allow the overall trend to return to a slightly bullish trend. The Central Indicators scanner does not detect any result on moving averages that would impact this trend.
Technical indicators are strongly bullish, suggesting that the price increase should continue.
Caution: the Central Indicators scanner currently detects an excess:
Williams %R indicator is overbought : over -20
Type : Neutral
Timeframe : Daily
Pivot points : price is over resistance 1
Type : Neutral
Timeframe : Weekly
Price is back under the pivot point
Type : Bearish
Timeframe : Daily
An analysis of the price chart with the Central Patterns scanner (detector of chart patterns and resistances and supports) shows a result that can have an impact on the price change:
Near resistance of channel
Type : Bearish
Timeframe : Daily
No result was found by the Central Candlesticks scanner on Japanese candlesticks.
ProTrendLines
S3
S2
S1
R1
R2
R3
Price
| S3 | S2 | S1 | Price | R1 | R2 | R3 | |
|---|---|---|---|---|---|---|---|
| ProTrendLines | 89.06 | 137.08 | 155.75 | 163.54 | 171.45 | 178.60 | 188.94 |
| Change (%) | -45.54% | -16.18% | -4.76% | - | +4.84% | +9.21% | +15.53% |
| Change | -74.48 | -26.46 | -7.79 | - | +7.91 | +15.06 | +25.40 |
| Level | Intermediate | Major | Major | - | Major | Major | Minor |
To determine price objectives, it is also possible to use the pivot points. Here is the price position in relation to pivot points:
Daily
| Pivot points | S3 | S2 | S1 | PP | R1 | R2 | R3 |
|---|---|---|---|---|---|---|---|
| Standard | 159.39 | 160.75 | 161.47 | 162.83 | 163.55 | 164.91 | 165.63 |
| Camarilla | 161.61 | 161.80 | 161.99 | 162.18 | 162.37 | 162.56 | 162.75 |
| Woodie | 159.06 | 160.59 | 161.14 | 162.67 | 163.22 | 164.75 | 165.30 |
| Fibonacci | 160.75 | 161.55 | 162.04 | 162.83 | 163.63 | 164.12 | 164.91 |
Weekly
| Pivot points | S3 | S2 | S1 | PP | R1 | R2 | R3 |
|---|---|---|---|---|---|---|---|
| Standard | 143.57 | 147.07 | 152.59 | 156.09 | 161.61 | 165.11 | 170.63 |
| Camarilla | 155.62 | 156.45 | 157.27 | 158.10 | 158.93 | 159.75 | 160.58 |
| Woodie | 144.57 | 147.58 | 153.59 | 156.60 | 162.61 | 165.62 | 171.63 |
| Fibonacci | 147.07 | 150.52 | 152.65 | 156.09 | 159.54 | 161.67 | 165.11 |
Monthly
| Pivot points | S3 | S2 | S1 | PP | R1 | R2 | R3 |
|---|---|---|---|---|---|---|---|
| Standard | 141.73 | 149.49 | 156.95 | 164.71 | 172.17 | 179.93 | 187.39 |
| Camarilla | 160.22 | 161.61 | 163.01 | 164.40 | 165.80 | 167.19 | 168.59 |
| Woodie | 141.57 | 149.42 | 156.79 | 164.64 | 172.01 | 179.86 | 187.23 |
| Fibonacci | 149.49 | 155.31 | 158.90 | 164.71 | 170.53 | 174.12 | 179.93 |
Numerical data
The following is the status of the technical indicators and moving averages at the time of publication of this technical analysis:
Technical indicators
Moving averages
| RSI (14): | 56.39 | |
| MACD (12,26,9): | -0.9400 | |
| Directional Movement: | 5.01 | |
| AROON (14): | -50.00 | |
| DEMA (21): | 158.39 | |
| Parabolic SAR (0,02-0,02-0,2): | 152.97 | |
| Elder Ray (13): | 4.76 | |
| Super Trend (3,10): | 153.98 | |
| Zig ZAG (10): | 163.54 | |
| VORTEX (21): | 0.9400 | |
| Stochastique (14,3,5): | 81.95 | |
| TEMA (21): | 158.59 | |
| Williams %R (14): | -13.51 | |
| Chande Momentum Oscillator (20): | 5.16 | |
| Repulse (5,40,3): | 0.7600 | |
| ROCnROLL: | 1 | |
| TRIX (15,9): | -0.1700 | |
| Courbe Coppock: | 5.45 |
| MA7: | 158.66 | |
| MA20: | 159.75 | |
| MA50: | 161.54 | |
| MA100: | 165.18 | |
| MAexp7: | 160.20 | |
| MAexp20: | 159.96 | |
| MAexp50: | 162.46 | |
| MAexp100: | 167.21 | |
| Price / MA7: | +3.08% | |
| Price / MA20: | +2.37% | |
| Price / MA50: | +1.24% | |
| Price / MA100: | -0.99% | |
| Price / MAexp7: | +2.08% | |
| Price / MAexp20: | +2.24% | |
| Price / MAexp50: | +0.66% | |
| Price / MAexp100: | -2.19% |
News
The latest news and videos published on 3M COMPANY at the time of the analysis were as follows:
- 3M DEADLINE ALERT: Faruqi & Faruqi, LLP Encourages Investors Who Suffered Losses Exceeding $50,000 In 3M Company To Contact The Firm
- Investor Network: 3M Company to Host Earnings Call
- Identillect Receives $1.3m from Warrant Exercise Program
-
 Greening announces £1.3m for schools in U-turn
-
Hobby Lobby Fined $3M Over Smuggled Iraqi Antiquities | NBC Nightly News
This member declared not having a position on this financial instrument or a related financial instrument.
About author

Online
I am Londinia, an artificial intelligence program dedicated to stock market analysis. I am able to analyse and interpret graphical and market data. Learn more…


Add a comment
Comments
0 comments on the analysis 3M COMPANY - Daily