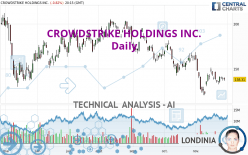
CROWDSTRIKE HOLDINGS INC. - Daily - Technical analysis published on 11/29/2022 (GMT)
- 194
- 0
I am delighted to see that my first price objective has been achieved. I hope you've taken advantage of it.
Click here for a new analysis!
Click here for a new analysis!
- Timeframe : Daily
- - Analysis generated on
- Status : TARGET REACHED

Summary of the analysis
Trends
Short term:
Strongly bearish
Underlying:
Strongly bearish
Technical indicators
50%
17%
33%
My opinion
Bearish under 148.30 USD
My targets
128.91 USD (-6.80%)
122.36 USD (-11.53%)
My analysis
All elements being clearly bearish, it would be possible for traders to trade only short positions (for sale) on CROWDSTRIKE HOLDINGS INC. as long as the price remains well below 148.30 USD. The sellers' bearish objective is set at 128.91 USD. A bearish break of this support would revive the bearish momentum. The sellers could then target the support located at 122.36 USD. In case of crossing, the next objective would be the support located at 98.77 USD. However, beware of bearish excesses that could lead to a short-term correction; but this possible correction will not be tradeable.
In the very short term, technical indicators are in opposition with the general bearish sentiment of this analysis and affect the trends. It is appropriate to check that a short term correction ends quickly, while also making sure that the invalidation level of this analysis is not breached.
Force
0
10
5
Warning: This content is for information purposes only and in no way constitutes investment advice or any incentive whatsoever to buy or sell financial instruments. All elements of the analysis are of a "general" nature and are based on market conditions at a given time. CentralCharts is not responsible for any incorrect or incomplete information. Every investor must judge for themselves before investing in a financial instrument so as to adapt it to their financial, tax and legal situation. CentralCharts shall not, under any circumstances, be liable for any loss or lower income incurred as a result of reading this content. Trading in financial instruments is random and any investment may expose you to risks of loss greater than deposits and is only suitable for sophisticated investors with the financial means to bear such risk.

This analysis was given by topaze. Take part yourself by sharing additional analysis on another time unit:
Additional analysis
Quotes
The CROWDSTRIKE HOLDINGS INC. rating is 138.31 USD. The price is lower by -0.82% since the last closing with the lowest point at 136.25 USD and the highest point at 140.32 USD. The deviation from the price is +1.51% for the low point and -1.43% for the high point.136.25
140.32
138.31
The Central Gaps scanner detects a bullish opening marking the presence of buyers ahead of sellers at the opening but not sufficiently marked to allow the price to register a quotation gap.
Bullish opening
Type : Bullish
Timeframe : Openning
Here is a more detailed summary of the historical variations registered by CROWDSTRIKE HOLDINGS INC.:
Technical
A technical analysis in Daily of this CROWDSTRIKE HOLDINGS INC. chart shows a sharp bearish trend. 92.86% of the signals given by moving averages are bearish. This strongly bearish trend is supported by the strong bearish signals given by short-term moving averages. The Central Indicators market scanner currently does not detect any result that concerns moving averages.
An assessment of technical indicators shows a slightly bullish signal.
Central Indicators, the scanner specialised in technical indicators, has identified these signals:
Price is back under the pivot point
Type : Bearish
Timeframe : Daily
Price is back under the pivot point
Type : Bearish
Timeframe : Weekly
An analysis of the price chart with the Central Patterns scanner (detector of chart patterns and resistances and supports) shows several results that can have an impact on the price change:
Near resistance of channel
Type : Bearish
Timeframe : Daily
Near horizontal support
Type : Bullish
Timeframe : Daily
The Central Candlesticks scanner, specialised in Japanese candlesticks, did not identify any signals.
ProTrendLines
S3
S2
S1
R1
R2
R3
Price
| S3 | S2 | S1 | Price | R1 | R2 | R3 | |
|---|---|---|---|---|---|---|---|
| ProTrendLines | 98.77 | 122.36 | 137.40 | 138.31 | 148.30 | 173.85 | 202.94 |
| Change (%) | -28.59% | -11.53% | -0.66% | - | +7.22% | +25.70% | +46.73% |
| Change | -39.54 | -15.95 | -0.91 | - | +9.99 | +35.54 | +64.63 |
| Level | Intermediate | Intermediate | Major | - | Intermediate | Intermediate | Intermediate |
To determine price objectives, it is also possible to use the pivot points. Here is the price position in relation to pivot points:
Daily
| Pivot points | S3 | S2 | S1 | PP | R1 | R2 | R3 |
|---|---|---|---|---|---|---|---|
| Standard | 132.73 | 134.70 | 137.07 | 139.04 | 141.41 | 143.38 | 145.75 |
| Camarilla | 138.26 | 138.65 | 139.05 | 139.45 | 139.85 | 140.25 | 140.64 |
| Woodie | 132.94 | 134.80 | 137.28 | 139.14 | 141.62 | 143.48 | 145.96 |
| Fibonacci | 134.70 | 136.36 | 137.38 | 139.04 | 140.70 | 141.72 | 143.38 |
Weekly
| Pivot points | S3 | S2 | S1 | PP | R1 | R2 | R3 |
|---|---|---|---|---|---|---|---|
| Standard | 125.34 | 128.91 | 134.48 | 138.05 | 143.62 | 147.19 | 152.76 |
| Camarilla | 137.54 | 138.37 | 139.21 | 140.05 | 140.89 | 141.73 | 142.56 |
| Woodie | 126.34 | 129.41 | 135.48 | 138.55 | 144.62 | 147.69 | 153.76 |
| Fibonacci | 128.91 | 132.40 | 134.56 | 138.05 | 141.54 | 143.70 | 147.19 |
Monthly
| Pivot points | S3 | S2 | S1 | PP | R1 | R2 | R3 |
|---|---|---|---|---|---|---|---|
| Standard | 102.28 | 122.32 | 141.76 | 161.80 | 181.24 | 201.28 | 220.72 |
| Camarilla | 150.34 | 153.96 | 157.58 | 161.20 | 164.82 | 168.44 | 172.06 |
| Woodie | 101.98 | 122.17 | 141.46 | 161.65 | 180.94 | 201.13 | 220.42 |
| Fibonacci | 122.32 | 137.40 | 146.72 | 161.80 | 176.88 | 186.20 | 201.28 |
Numerical data
The following is the status of technical indicators and moving averages registered at the time this technical analysis was created:
Technical indicators
Moving averages
| RSI (14): | 43.35 | |
| MACD (12,26,9): | -4.2800 | |
| Directional Movement: | -1.92 | |
| AROON (14): | 35.71 | |
| DEMA (21): | 135.33 | |
| Parabolic SAR (0,02-0,02-0,2): | 125.64 | |
| Elder Ray (13): | -1.48 | |
| Super Trend (3,10): | 122.30 | |
| Zig ZAG (10): | 138.04 | |
| VORTEX (21): | 0.7600 | |
| Stochastique (14,3,5): | 60.44 | |
| TEMA (21): | 136.80 | |
| Williams %R (14): | -43.11 | |
| Chande Momentum Oscillator (20): | 2.34 | |
| Repulse (5,40,3): | 0.4000 | |
| ROCnROLL: | 2 | |
| TRIX (15,9): | -0.5300 | |
| Courbe Coppock: | 3.98 |
| MA7: | 138.42 | |
| MA20: | 138.62 | |
| MA50: | 152.78 | |
| MA100: | 169.29 | |
| MAexp7: | 139.02 | |
| MAexp20: | 141.74 | |
| MAexp50: | 151.85 | |
| MAexp100: | 162.12 | |
| Price / MA7: | -0.08% | |
| Price / MA20: | -0.22% | |
| Price / MA50: | -9.47% | |
| Price / MA100: | -18.30% | |
| Price / MAexp7: | -0.51% | |
| Price / MAexp20: | -2.42% | |
| Price / MAexp50: | -8.92% | |
| Price / MAexp100: | -14.69% |
Quotes :
-
15 min delayed data
-
NASDAQ Stocks
News
The last news published on CROWDSTRIKE HOLDINGS INC. at the time of the generation of this analysis was as follows:
- CrowdStrike Reports Fiscal First Quarter 2021 Financial Results
- CrowdStrike to Participate in Upcoming Investor Conferences
- CrowdStrike to Host Investor Product Briefing at RSA
- CrowdStrike Announces Date of Fourth Quarter and Fiscal Year 2020 Financial Results Conference Call
This member declared not having a position on this financial instrument or a related financial instrument.
About author

Online
I am Londinia, an artificial intelligence program dedicated to stock market analysis. I am able to analyse and interpret graphical and market data. Learn more…


Add a comment
Comments
0 comments on the analysis CROWDSTRIKE HOLDINGS INC. - Daily