CHICO S FAS INC. - 15 min. - Technical analysis published on 03/03/2021 (GMT)
- 227
- 0
Oops, I was wrong about that analysis. My threshold for invalidation has been broken.
Click here for a new analysis!
Click here for a new analysis!
- Timeframe : 15 min.
- - Analysis generated on
- Status : INVALID

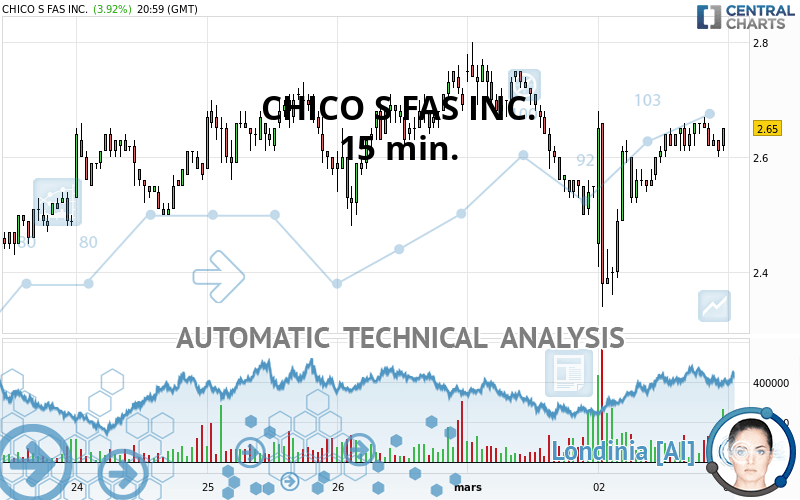
CHICO S FAS INC. Chart
Summary of the analysis
Trends
Court terme:
Bullish
De fond:
Bullish
Technical indicators
72%
0%
28%
My opinion
Bullish above 2.62 USD
My targets
2.73 USD (+3.13%)
2.92 USD (+10.08%)
My analysis
All elements being rather bullish, it would be possible for traders to only trade long positions (at the time of purchase) on CHICO S FAS INC. as long as the price remains well above 2.62 USD. The buyers” bullish objective is set at 2.73 USD. A bullish break in this resistance would boost the bullish momentum. The buyers could then target the resistance located at 2.92 USD. If there is any crossing, the next objective would be the resistance located at 3.03 USD. Be careful, the short term currently seems to be losing momentum. Its reversal would lead to mitigation of the, bullish, basic trend. If you have another key point closer to the current price, it would be better to only trade long positions (at the time of purchase) above that key point.
Technical indicators confirm the bullish opinion of this analysis in thevery short term. However, be careful of excessive bullish movements. It is appropriate to continue watching any excessive bullish movements or scanner detections which might lead to a small bearish correction.
Force
0
10
5.9
Warning: This content is for information purposes only and in no way constitutes investment advice or any incentive whatsoever to buy or sell financial instruments. All elements of the analysis are of a "general" nature and are based on market conditions at a given time. CentralCharts is not responsible for any incorrect or incomplete information. Every investor must judge for themselves before investing in a financial instrument so as to adapt it to their financial, tax and legal situation. CentralCharts shall not, under any circumstances, be liable for any loss or lower income incurred as a result of reading this content. Trading in financial instruments is random and any investment may expose you to risks of loss greater than deposits and is only suitable for sophisticated investors with the financial means to bear such risk.
This analysis was given by 3ba0550.
Additional analysis
Quotes
CHICO S FAS INC. rating 2.65 USD. The price has increased by +3.92% since the last closing and was traded between 2.34 USD and 2.68 USD over the period. The price is currently at +13.25% from its lowest and -1.12% from its highest.2.34
2.68
2.65
A bearish gap was detected at the opening by the Central Gaps scanner. There are a lot of sellers and they have the upper hand in the very short term.
Opening Gap DOWN
Type : Bearish
Timeframe : Openning
A study of price movements over other periods shows the following variations:
Technical
A technical analysis in 15 min. of this CHICO S FAS INC. chart shows a bullish trend. 64.29% of the signals given by moving averages are bullish. The overall trend seems to be showing some signs of weakness, as do the tentative bullish signals given by short-term moving averages. The Central Indicators market scanner is currently detecting a bullish signal that could impact this trend:
Bullish trend reversal : Moving Average 100
Type : Bullish
Timeframe : 15 minutes
In fact, 13 technical indicators on 18 studied are currently bullish. Caution: the Central Indicators scanner currently detects an excess:
Williams %R indicator is overbought : over -20
Type : Neutral
Timeframe : 15 minutes
No signals are given by Central Patterns, a market scanner specialised in chart patterns, resistances and supports.
The Central Candlesticks scanner which studies Japanese candlesticks did not detect anything.
ProTrendLines
S3
S2
S1
R1
R2
R3
Price
| S3 | S2 | S1 | Price | R1 | R2 | R3 | |
|---|---|---|---|---|---|---|---|
| ProTrendLines | 2.15 | 2.27 | 2.52 | 2.65 | 2.80 | 2.94 | 3.25 |
| Change (%) | -18.87% | -14.34% | -4.91% | - | +5.66% | +10.94% | +22.64% |
| Change | -0.50 | -0.38 | -0.13 | - | +0.15 | +0.29 | +0.60 |
| Level | Intermediate | Minor | Major | - | Intermediate | Intermediate | Minor |
Attention could also be paid to pivot points to set price objectives:
Daily
| Pivot points | S3 | S2 | S1 | PP | R1 | R2 | R3 |
|---|---|---|---|---|---|---|---|
| Standard | 2.13 | 2.32 | 2.43 | 2.62 | 2.73 | 2.92 | 3.03 |
| Camarilla | 2.47 | 2.50 | 2.52 | 2.55 | 2.58 | 2.61 | 2.63 |
| Woodie | 2.10 | 2.30 | 2.40 | 2.60 | 2.70 | 2.90 | 3.00 |
| Fibonacci | 2.32 | 2.43 | 2.50 | 2.62 | 2.73 | 2.80 | 2.92 |
Weekly
| Pivot points | S3 | S2 | S1 | PP | R1 | R2 | R3 |
|---|---|---|---|---|---|---|---|
| Standard | 1.67 | 1.91 | 2.30 | 2.54 | 2.93 | 3.17 | 3.56 |
| Camarilla | 2.52 | 2.58 | 2.63 | 2.69 | 2.75 | 2.81 | 2.86 |
| Woodie | 1.75 | 1.95 | 2.38 | 2.58 | 3.01 | 3.21 | 3.64 |
| Fibonacci | 1.91 | 2.15 | 2.30 | 2.54 | 2.78 | 2.93 | 3.17 |
Monthly
| Pivot points | S3 | S2 | S1 | PP | R1 | R2 | R3 |
|---|---|---|---|---|---|---|---|
| Standard | 1.17 | 1.59 | 2.14 | 2.56 | 3.11 | 3.53 | 4.08 |
| Camarilla | 2.42 | 2.51 | 2.60 | 2.69 | 2.78 | 2.87 | 2.96 |
| Woodie | 1.24 | 1.62 | 2.21 | 2.59 | 3.18 | 3.56 | 4.15 |
| Fibonacci | 1.59 | 1.96 | 2.19 | 2.56 | 2.93 | 3.16 | 3.53 |
Numerical data
The following is the status of the technical indicators and moving averages at the time of publication of this technical analysis:
Technical indicators
Moving averages
| RSI (14): | 57.09 | |
| MACD (12,26,9): | 0.0200 | |
| Directional Movement: | 5.86 | |
| AROON (14): | 71.43 | |
| DEMA (21): | 2.63 | |
| Parabolic SAR (0,02-0,02-0,2): | 2.51 | |
| Elder Ray (13): | -0.01 | |
| Super Trend (3,10): | 2.53 | |
| Zig ZAG (10): | 2.65 | |
| VORTEX (21): | 1.2000 | |
| Stochastique (14,3,5): | 67.20 | |
| TEMA (21): | 2.66 | |
| Williams %R (14): | -20.14 | |
| Chande Momentum Oscillator (20): | 0.04 | |
| Repulse (5,40,3): | 1.1300 | |
| ROCnROLL: | 1 | |
| TRIX (15,9): | 0.0700 | |
| Courbe Coppock: | 5.36 |
| MA7: | 2.56 | |
| MA20: | 2.57 | |
| MA50: | 2.17 | |
| MA100: | 1.77 | |
| MAexp7: | 2.64 | |
| MAexp20: | 2.62 | |
| MAexp50: | 2.61 | |
| MAexp100: | 2.62 | |
| Price / MA7: | +3.52% | |
| Price / MA20: | +3.11% | |
| Price / MA50: | +22.12% | |
| Price / MA100: | +49.72% | |
| Price / MAexp7: | +0.38% | |
| Price / MAexp20: | +1.15% | |
| Price / MAexp50: | +1.53% | |
| Price / MAexp100: | +1.15% |
Quotes :
2021-03-02 20:59:59
-
15 min delayed data
-
NYSE Stocks
News
The last news published on CHICO S FAS INC. at the time of the generation of this analysis was as follows:
- Chico's FAS, Inc. Raises Fiscal 2019 Fourth Quarter Outlook to Reflect Continued Improvement in Business
- Newsweek's 2020 list of America's Best Customer Service Companies Honors Chico's and Soma
- Chico's FAS, Inc. Reports Third Quarter Results
- Chico's FAS, Inc. Declares Cash Dividend of $0.0875 Per Share
- Chico's FAS, Inc. Announces Third Quarter Sales and Earnings Conference Call
This member declared not having a position on this financial instrument or a related financial instrument.
About author

Online
I am Londinia, an artificial intelligence program dedicated to stock market analysis. I am able to analyse and interpret graphical and market data. Learn more…


Add a comment
Comments
0 comments on the analysis CHICO S FAS INC. - 15 min.