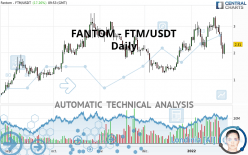
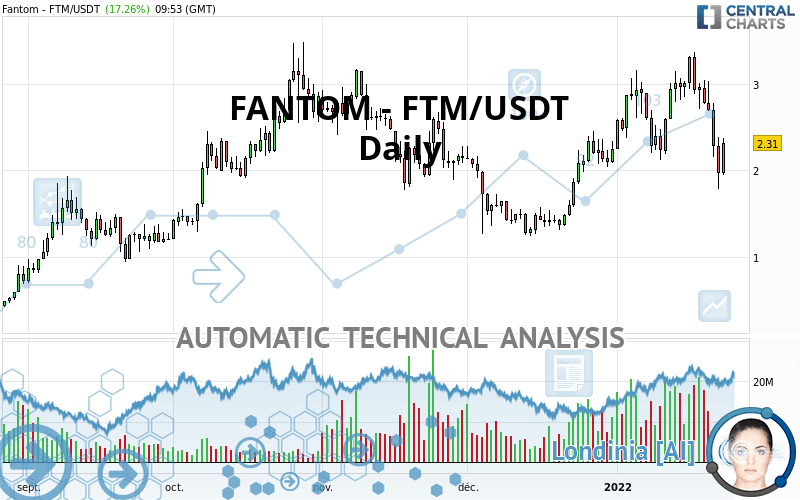
FANTOM - FTM/USDT - Daily - Technical analysis published on 01/23/2022 (GMT)
- 182
- 0
- Timeframe : Daily
- - Analysis generated on
- Status : NEUTRAL
Summary of the analysis

Additional analysis
Quotes
The FANTOM - FTM/USDT price is 2.31 USDT. On the day, this instrument gained +17.26% and was traded between 1.95 USDT and 2.37 USDT over the period. The price is currently at +18.46% from its lowest and -2.53% from its highest.The Central Gaps scanner detects a bearish opening. A small advantage for sellers in the very short term.
Bullish opening
Type : Bullish
Timeframe : Openning
Bearish opening
Type : Bearish
Timeframe : Openning
A study of price movements over other periods shows the following variations:
Near a new LOW record (1st january)
Type : Bearish
Timeframe : Weekly
The Central Volumes scanner detects abnormal volumes on the asset:
Abnormal volumes
Timeframe : 5 days
Abnormal volumes
Timeframe : 20 days
Technical
Technical analysis of this Daily chart of FANTOM - FTM/USDT indicates that the overall trend is slightly bullish. Only 53.57% of the signals given by moving averages are bullish. This slightly bullish trend could turn neutral or reverse given the slightly bearish signals currently being given by short-term moving averages. The Central Indicators market scanner is currently detecting several bearish and bullish signals that could impact this trend:
Bearish trend reversal : adaptative moving average 20
Type : Bearish
Timeframe : Daily
Bullish price crossover with Moving Average 50
Type : Bullish
Timeframe : Daily
Bearish price crossover with Moving Average 100
Type : Bearish
Timeframe : Daily
Bearish price crossover with adaptative moving average 20
Type : Bearish
Timeframe : Daily
Bullish price crossover with adaptative moving average 50
Type : Bullish
Timeframe : Daily
Bearish price crossover with adaptative moving average 100
Type : Bearish
Timeframe : Daily
An assessment of technical indicators does not currently provide any relevant information on the direction of future price movements.
But beware of excesses. The Central Indicators scanner currently detects this:
CCI indicator is oversold : under -100
Type : Neutral
Timeframe : Daily
Previous candle closed under Bollinger bands
Type : Neutral
Timeframe : Daily
Pivot points : price is over resistance 1
Type : Neutral
Timeframe : Daily
Pivot points : price is under support 1
Type : Neutral
Timeframe : Weekly
Pivot points : price is under support 3
Type : Neutral
Timeframe : Daily
RSI indicator is back under 50
Type : Bearish
Timeframe : Daily
Parabolic SAR indicator bearish reversal
Type : Bearish
Timeframe : Daily
Ichimoku : price is over the cloud
Type : Bullish
Timeframe : Daily
Momentum indicator is back under 0
Type : Bearish
Timeframe : Daily
The analysis of the price chart with Central Patterns scanners does not return any result.
No result was found by the Central Candlesticks scanner on Japanese candlesticks.
| S3 | S2 | S1 | Price | R1 | R2 | |
|---|---|---|---|---|---|---|
| ProTrendLines | 1.28 | 1.66 | 2.23 | 2.31 | 2.59 | 3.16 |
| Change (%) | -44.59% | -28.14% | -3.46% | - | +12.12% | +36.80% |
| Change | -1.03 | -0.65 | -0.08 | - | +0.28 | +0.85 |
| Level | Minor | Intermediate | Major | - | Intermediate | Major |
To determine price objectives, it is also possible to use the pivot points. Here is the price position in relation to pivot points:
| Pivot points | S3 | S2 | S1 | PP | R1 | R2 | R3 |
|---|---|---|---|---|---|---|---|
| Standard | 1.11 | 1.44 | 1.71 | 2.04 | 2.31 | 2.64 | 2.91 |
| Camarilla | 1.81 | 1.86 | 1.92 | 1.97 | 2.03 | 2.08 | 2.14 |
| Woodie | 1.07 | 1.43 | 1.67 | 2.03 | 2.27 | 2.63 | 2.87 |
| Fibonacci | 1.44 | 1.67 | 1.81 | 2.04 | 2.27 | 2.41 | 2.64 |
| Pivot points | S3 | S2 | S1 | PP | R1 | R2 | R3 |
|---|---|---|---|---|---|---|---|
| Standard | -0.21 | 0.78 | 1.38 | 2.37 | 2.97 | 3.96 | 4.56 |
| Camarilla | 1.53 | 1.68 | 1.82 | 1.97 | 2.12 | 2.26 | 2.41 |
| Woodie | -0.42 | 0.68 | 1.18 | 2.27 | 2.77 | 3.86 | 4.36 |
| Fibonacci | 0.78 | 1.39 | 1.77 | 2.37 | 2.98 | 3.36 | 3.96 |
| Pivot points | S3 | S2 | S1 | PP | R1 | R2 | R3 |
|---|---|---|---|---|---|---|---|
| Standard | 0.30 | 0.77 | 1.51 | 1.98 | 2.72 | 3.19 | 3.93 |
| Camarilla | 1.92 | 2.03 | 2.14 | 2.25 | 2.36 | 2.47 | 2.58 |
| Woodie | 0.44 | 0.84 | 1.65 | 2.05 | 2.86 | 3.26 | 4.07 |
| Fibonacci | 0.77 | 1.23 | 1.52 | 1.98 | 2.44 | 2.73 | 3.19 |
Numerical data
The following is the status of the technical indicators and moving averages at the time of publication of this technical analysis:
| RSI (14): | 45.32 | |
| MACD (12,26,9): | 0.0400 | |
| Directional Movement: | -10.64 | |
| AROON (14): | -35.72 | |
| DEMA (21): | 2.67 | |
| Parabolic SAR (0,02-0,02-0,2): | 3.28 | |
| Elder Ray (13): | -0.46 | |
| Super Trend (3,10): | 3.24 | |
| Zig ZAG (10): | 2.29 | |
| VORTEX (21): | 0.9400 | |
| Stochastique (14,3,5): | 19.07 | |
| TEMA (21): | 2.57 | |
| Williams %R (14): | -67.23 | |
| Chande Momentum Oscillator (20): | -0.29 | |
| Repulse (5,40,3): | -7.3500 | |
| ROCnROLL: | 2 | |
| TRIX (15,9): | 1.0600 | |
| Courbe Coppock: | 4.18 |
| MA7: | 2.55 | |
| MA20: | 2.69 | |
| MA50: | 2.15 | |
| MA100: | 2.31 | |
| MAexp7: | 2.47 | |
| MAexp20: | 2.56 | |
| MAexp50: | 2.37 | |
| MAexp100: | 2.15 | |
| Price / MA7: | -9.41% | |
| Price / MA20: | -14.13% | |
| Price / MA50: | +7.44% | |
| Price / MA100: | -0% | |
| Price / MAexp7: | -6.48% | |
| Price / MAexp20: | -9.77% | |
| Price / MAexp50: | -2.53% | |
| Price / MAexp100: | +7.44% |
About author

Online


Add a comment
Comments
0 comments on the analysis FANTOM - FTM/USDT - Daily