FANTOM - FTM/USDT - Daily - Technical analysis published on 01/23/2022 (GMT)
- 161
- 0
- Timeframe : Daily
- - Analysis generated on
- Status : NEUTRAL
Summary of the analysis

Additional analysis
Quotes
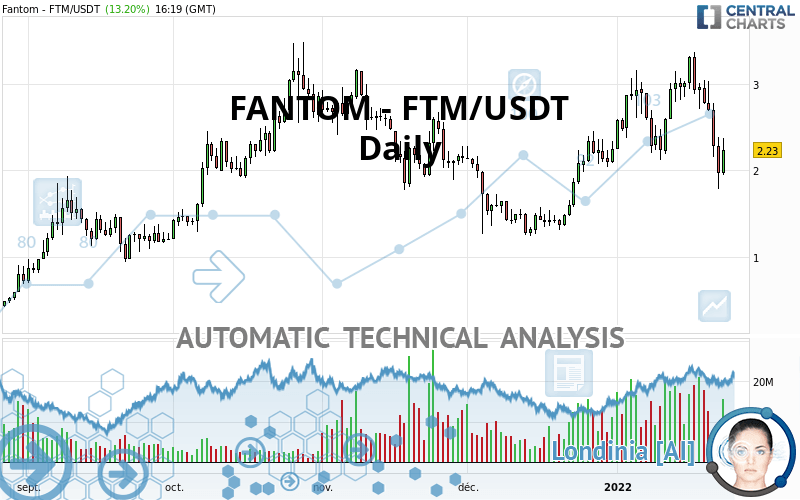
The FANTOM - FTM/USDT price is 2.23 USDT. The price has increased by +13.20% since the last closing and was traded between 1.95 USDT and 2.37 USDT over the period. The price is currently at +14.36% from its lowest and -5.91% from its highest.The Central Gaps scanner detects a bearish opening marking the presence of sellers ahead of buyers at the opening but not sufficiently marked to allow the price to register a quotation gap.
Bullish opening
Type : Bullish
Timeframe : Openning
Bearish opening
Type : Bearish
Timeframe : Openning
A study of price movements over other periods shows the following variations:
Near a new LOW record (1st january)
Type : Bearish
Timeframe : Weekly
Abnormal volumes on FANTOM - FTM/USDT were detected by the Central Volumes scanner:
Abnormal volumes
Timeframe : 5 days
Abnormal volumes
Timeframe : 20 days
Technical
A technical analysis in Daily of this FANTOM - FTM/USDT chart shows a slightly bullish trend. Only 53.57% of the signals given by moving averages are bullish. This slightly bullish trend could turn neutral or reverse given the slightly bearish signals currently being given by short-term moving averages. The Central Indicators scanner detects bullish and bearish signals on moving averages that could impact this trend:
Bearish trend reversal : adaptative moving average 20
Type : Bearish
Timeframe : Daily
Bullish price crossover with Moving Average 50
Type : Bullish
Timeframe : Daily
Bearish price crossover with Moving Average 100
Type : Bearish
Timeframe : Daily
Bearish price crossover with adaptative moving average 20
Type : Bearish
Timeframe : Daily
Bullish price crossover with adaptative moving average 50
Type : Bullish
Timeframe : Daily
Bearish price crossover with adaptative moving average 100
Type : Bearish
Timeframe : Daily
On the 18 technical indicators analysed, 4 are bullish, 3 are neutral and 11 are bearish. But beware of excesses. The Central Indicators scanner currently detects this:
CCI indicator is oversold : under -100
Type : Neutral
Timeframe : Daily
Previous candle closed under Bollinger bands
Type : Neutral
Timeframe : Daily
Pivot points : price is under support 1
Type : Neutral
Timeframe : Weekly
Pivot points : price is under support 3
Type : Neutral
Timeframe : Daily
RSI indicator is back under 50
Type : Bearish
Timeframe : Daily
Parabolic SAR indicator bearish reversal
Type : Bearish
Timeframe : Daily
Price is back over the pivot point
Type : Bullish
Timeframe : Daily
Momentum indicator is back under 0
Type : Bearish
Timeframe : Daily
The analysis of the price chart with Central Patterns scanners does not return any result.
For a small rebound in the very short term, the Central Candlesticks scanner currently notes the presence of this bullish pattern in Japanese candlesticks:
Bullish harami
Type : Bullish
Timeframe : Daily
| S3 | S2 | S1 | Price | R1 | R2 | |
|---|---|---|---|---|---|---|
| ProTrendLines | 1.28 | 1.66 | 2.23 | 2.23 | 2.59 | 3.16 |
| Change (%) | -42.60% | -25.56% | 0% | - | +16.14% | +41.70% |
| Change | -0.95 | -0.57 | 0 | - | +0.36 | +0.93 |
| Level | Minor | Intermediate | Major | - | Intermediate | Major |
To determine price objectives, it is also possible to use the pivot points. Here is the price position in relation to pivot points:
| Pivot points | S3 | S2 | S1 | PP | R1 | R2 | R3 |
|---|---|---|---|---|---|---|---|
| Standard | 1.11 | 1.44 | 1.71 | 2.04 | 2.31 | 2.64 | 2.91 |
| Camarilla | 1.81 | 1.86 | 1.92 | 1.97 | 2.03 | 2.08 | 2.14 |
| Woodie | 1.07 | 1.43 | 1.67 | 2.03 | 2.27 | 2.63 | 2.87 |
| Fibonacci | 1.44 | 1.67 | 1.81 | 2.04 | 2.27 | 2.41 | 2.64 |
| Pivot points | S3 | S2 | S1 | PP | R1 | R2 | R3 |
|---|---|---|---|---|---|---|---|
| Standard | -0.21 | 0.78 | 1.38 | 2.37 | 2.97 | 3.96 | 4.56 |
| Camarilla | 1.53 | 1.68 | 1.82 | 1.97 | 2.12 | 2.26 | 2.41 |
| Woodie | -0.42 | 0.68 | 1.18 | 2.27 | 2.77 | 3.86 | 4.36 |
| Fibonacci | 0.78 | 1.39 | 1.77 | 2.37 | 2.98 | 3.36 | 3.96 |
| Pivot points | S3 | S2 | S1 | PP | R1 | R2 | R3 |
|---|---|---|---|---|---|---|---|
| Standard | 0.30 | 0.77 | 1.51 | 1.98 | 2.72 | 3.19 | 3.93 |
| Camarilla | 1.92 | 2.03 | 2.14 | 2.25 | 2.36 | 2.47 | 2.58 |
| Woodie | 0.44 | 0.84 | 1.65 | 2.05 | 2.86 | 3.26 | 4.07 |
| Fibonacci | 0.77 | 1.23 | 1.52 | 1.98 | 2.44 | 2.73 | 3.19 |
Numerical data
The following is the status of technical indicators and moving averages registered at the time this technical analysis was created:
| RSI (14): | 43.51 | |
| MACD (12,26,9): | 0.0300 | |
| Directional Movement: | -10.46 | |
| AROON (14): | -35.72 | |
| DEMA (21): | 2.66 | |
| Parabolic SAR (0,02-0,02-0,2): | 3.28 | |
| Elder Ray (13): | -0.40 | |
| Super Trend (3,10): | 3.24 | |
| Zig ZAG (10): | 2.20 | |
| VORTEX (21): | 0.9400 | |
| Stochastique (14,3,5): | 16.99 | |
| TEMA (21): | 2.55 | |
| Williams %R (14): | -73.52 | |
| Chande Momentum Oscillator (20): | -0.39 | |
| Repulse (5,40,3): | -17.3300 | |
| ROCnROLL: | 2 | |
| TRIX (15,9): | 1.0600 | |
| Courbe Coppock: | 5.47 |
| MA7: | 2.54 | |
| MA20: | 2.69 | |
| MA50: | 2.15 | |
| MA100: | 2.31 | |
| MAexp7: | 2.44 | |
| MAexp20: | 2.55 | |
| MAexp50: | 2.37 | |
| MAexp100: | 2.14 | |
| Price / MA7: | -12.20% | |
| Price / MA20: | -17.10% | |
| Price / MA50: | +3.72% | |
| Price / MA100: | -3.46% | |
| Price / MAexp7: | -8.61% | |
| Price / MAexp20: | -12.55% | |
| Price / MAexp50: | -5.91% | |
| Price / MAexp100: | +4.21% |
About author

Online


Add a comment
Comments
0 comments on the analysis FANTOM - FTM/USDT - Daily