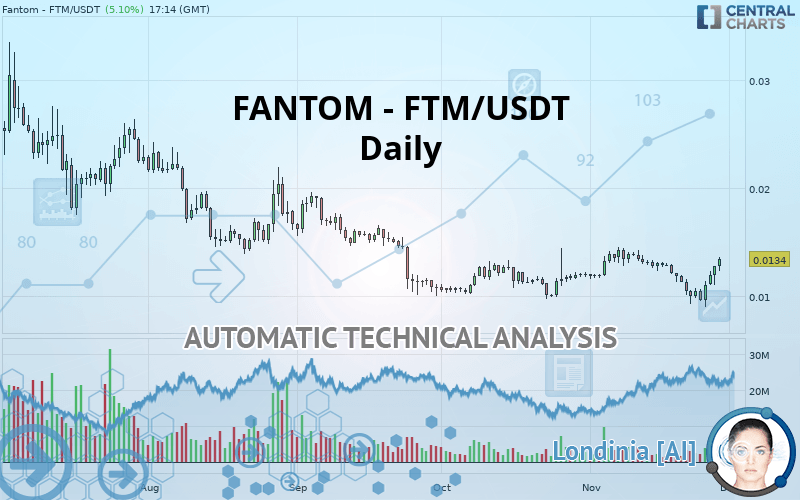
FANTOM - FTM/USDT - Daily - Technical analysis published on 11/28/2019 (GMT)
- Who voted?
- 169
- 0
- Timeframe : Daily
- - Analysis generated on
- Status : NEUTRAL

Summary of the analysis

Additional analysis
Quotes
The FANTOM - FTM/USDT rating is 0.013400 USDT. On the day, this instrument gained +5.10% and was traded between 0.012350 USDT and 0.013590 USDT over the period. The price is currently at +8.50% from its lowest and -1.40% from its highest.So that you have an overall view of the price change, here is a table showing the variations over several periods:
Technical
Technical analysis of this Daily chart of FANTOM - FTM/USDT indicates that the overall trend is not clearly defined. This indecision could turn into a bullish trend due to the slightly bullish signals currently given by short-term moving averages. The Central Indicators scanner detects bullish signals on moving averages that could impact this trend:
Bullish trend reversal : adaptative moving average 50
Type : Bullish
Timeframe : Daily
Bullish price crossover with Moving Average 20
Type : Bullish
Timeframe : Daily
Bullish price crossover with Moving Average 50
Type : Bullish
Timeframe : Daily
Bullish price crossover with adaptative moving average 20
Type : Bullish
Timeframe : Daily
In fact, according to the parameters integrated into the Central Analyzer system, 13 technical indicators out of 18 analysed are currently bullish. But beware of excesses. The Central Indicators scanner currently detects this:
Williams %R indicator is overbought : over -20
Type : Neutral
Timeframe : Daily
Pivot points : price is over resistance 1
Type : Neutral
Timeframe : Daily
Pivot points : price is over resistance 1
Type : Neutral
Timeframe : Weekly
Parabolic SAR indicator bullish reversal
Type : Bullish
Timeframe : Daily
SuperTrend indicator bullish reversal
Type : Bullish
Timeframe : Daily
Price is back under the pivot point
Type : Bearish
Timeframe : Weekly
An analysis of the price chart with the Central Patterns scanner (detector of chart patterns and resistances and supports) shows a result that can have an impact on the price change:
Support of channel is broken
Type : Bearish
Timeframe : Daily
The Central Candlesticks scanner, specialised in Japanese candlesticks, did not identify any signals.
| S2 | S1 | Price | R1 | R2 | R3 | |
|---|---|---|---|---|---|---|
| ProTrendLines | 0.007700 | 0.010220 | 0.013400 | 0.014350 | 0.021720 | 0.025370 |
| Change (%) | -42.54% | -23.73% | - | +7.09% | +62.09% | +89.33% |
| Change | -0.005700 | -0.003180 | - | +0.000950 | +0.008320 | +0.011970 |
| Level | Minor | Major | - | Intermediate | Minor | Minor |
To determine price objectives, it is also possible to use the pivot points. Here is the price position in relation to pivot points:
| Pivot points | S3 | S2 | S1 | PP | R1 | R2 | R3 |
|---|---|---|---|---|---|---|---|
| Standard | 0.009773 | 0.010397 | 0.011573 | 0.012197 | 0.013373 | 0.013997 | 0.015173 |
| Camarilla | 0.012255 | 0.012420 | 0.012585 | 0.012750 | 0.012915 | 0.013080 | 0.013245 |
| Woodie | 0.010050 | 0.010535 | 0.011850 | 0.012335 | 0.013650 | 0.014135 | 0.015450 |
| Fibonacci | 0.010397 | 0.011084 | 0.011509 | 0.012197 | 0.012884 | 0.013309 | 0.013997 |
| Pivot points | S3 | S2 | S1 | PP | R1 | R2 | R3 |
|---|---|---|---|---|---|---|---|
| Standard | 0.004982 | 0.007121 | 0.008821 | 0.010960 | 0.012660 | 0.014799 | 0.016499 |
| Camarilla | 0.009464 | 0.009816 | 0.010168 | 0.010520 | 0.010872 | 0.011224 | 0.011576 |
| Woodie | 0.004762 | 0.007011 | 0.008601 | 0.010850 | 0.012440 | 0.014689 | 0.016279 |
| Fibonacci | 0.007121 | 0.008588 | 0.009494 | 0.010960 | 0.012427 | 0.013333 | 0.014799 |
| Pivot points | S3 | S2 | S1 | PP | R1 | R2 | R3 |
|---|---|---|---|---|---|---|---|
| Standard | 0.005060 | 0.007420 | 0.009740 | 0.012100 | 0.014420 | 0.016780 | 0.019100 |
| Camarilla | 0.010773 | 0.011202 | 0.011631 | 0.012060 | 0.012489 | 0.012918 | 0.013347 |
| Woodie | 0.005040 | 0.007410 | 0.009720 | 0.012090 | 0.014400 | 0.016770 | 0.019080 |
| Fibonacci | 0.007420 | 0.009208 | 0.010312 | 0.012100 | 0.013888 | 0.014992 | 0.016780 |
Numerical data
The following is the status of the technical indicators and moving averages at the time of publication of this technical analysis:
| RSI (14): | 58.90 | |
| MACD (12,26,9): | -0.0002 | |
| Directional Movement: | 4.744625 | |
| AROON (14): | 21.428574 | |
| DEMA (21): | 0.011766 | |
| Parabolic SAR (0,02-0,02-0,2): | 0.009087 | |
| Elder Ray (13): | 0.001066 | |
| Super Trend (3,10): | 0.009436 | |
| Zig ZAG (10): | 0.013420 | |
| VORTEX (21): | 0.9681 | |
| Stochastique (14,3,5): | 83.12 | |
| TEMA (21): | 0.011689 | |
| Williams %R (14): | -3.71 | |
| Chande Momentum Oscillator (20): | 0.000500 | |
| Repulse (5,40,3): | 22.3932 | |
| ROCnROLL: | 1 | |
| TRIX (15,9): | -0.2949 | |
| Courbe Coppock: | 24.07 |
| MA7: | 0.011338 | |
| MA20: | 0.012219 | |
| MA50: | 0.012134 | |
| MA100: | 0.013469 | |
| MAexp7: | 0.012004 | |
| MAexp20: | 0.011989 | |
| MAexp50: | 0.012426 | |
| MAexp100: | 0.013593 | |
| Price / MA7: | +18.19% | |
| Price / MA20: | +9.67% | |
| Price / MA50: | +10.43% | |
| Price / MA100: | -0.51% | |
| Price / MAexp7: | +11.63% | |
| Price / MAexp20: | +11.77% | |
| Price / MAexp50: | +7.84% | |
| Price / MAexp100: | -1.42% |
About author

Online


Add a comment
Comments
0 comments on the analysis FANTOM - FTM/USDT - Daily