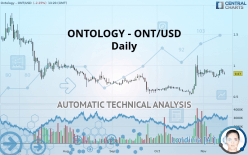
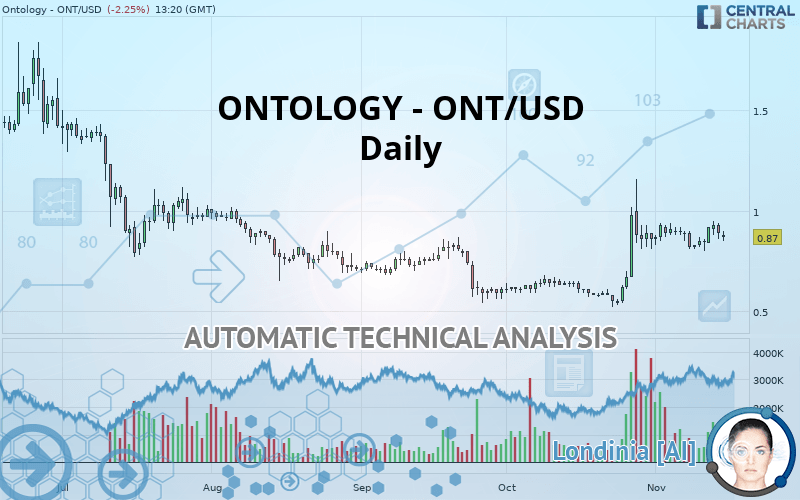
ONTOLOGY - ONT/USD - Daily - Technical analysis published on 11/15/2019 (GMT)
- Who voted?
- 235
- 0
Oops, I was wrong about that analysis. My threshold for invalidation has been broken.
Click here for a new analysis!
Click here for a new analysis!
- Timeframe : Daily
- - Analysis generated on
- Status : INVALID
Summary of the analysis
Trends
Court terme:
Bullish
De fond:
Bullish
Technical indicators
33%
28%
39%
My opinion
Bullish above 0.828000 USD
My targets
0.978000 USD (+12.41%)
1.250000 USD (+43.68%)
My analysis
A bullish trend on ONTOLOGY - ONT/USD both in substance and in the short term. A purchase could be considered as long as the price remains above 0.828000 USD. Each resistance break is a strong signal that the current trend will continue. The first bullish objective would be 0.978000 USD. Then the price could move towards 1.250000 USD. Then 1.760000 USD by extension. Be careful, a return below 0.828000 USD would be a sign of the trend weakening and a possible correction phase could then occur. In this case, you could keep away while waiting for a signal that the basic trend will resume. Trading against the trend could be riskier.
Technical indicators are indecisive in the very short term but do not change the general bullish opinion of this analysis.
FORCE
0
10
3.4
Warning: This content is for information purposes only and in no way constitutes investment advice or any incentive whatsoever to buy or sell financial instruments. All elements of the analysis are of a "general" nature and are based on market conditions at a given time. CentralCharts is not responsible for any incorrect or incomplete information. Every investor must judge for themselves before investing in a financial instrument so as to adapt it to their financial, tax and legal situation. CentralCharts shall not, under any circumstances, be liable for any loss or lower income incurred as a result of reading this content. Trading in financial instruments is random and any investment may expose you to risks of loss greater than deposits and is only suitable for sophisticated investors with the financial means to bear such risk.

This analysis was given by Vincent Launay. Take part yourself by sharing additional analysis on another time unit:
Additional analysis
Quotes
ONTOLOGY - ONT/USD rating 0.870000 USD. The price is lower by -2.25% since the last closing and was between 0.850000 USD and 0.900000 USD. This implies that the price is at +2.35% from its lowest and at -3.33% from its highest.0.850000
0.900000
0.870000
The Central Gaps scanner detects a bearish opening. A small advantage for sellers in the very short term.
Bearish opening
Type : Bearish
Timeframe : Openning
Here is a more detailed summary of the historical variations registered by ONTOLOGY - ONT/USD:
Abnormal volumes
Timeframe : 5 days
Abnormal volumes
Timeframe : 20 days
Abnormal volumes
Timeframe : 50 days
Technical
Technical analysis of this Daily chart of ONTOLOGY - ONT/USD indicates that the overall trend is bullish. 67.86% of the signals given by moving averages are bullish. The overall trend seems to be showing some signs of weakness, as do the tentative bullish signals given by short-term moving averages. The Central Indicators scanner does not detect any result on moving averages that would impact this trend.
In fact, of the 18 technical indicators analysed by Central Analyzer, 6 are bullish, 7 are neutral and 5 are bearish. Caution: the Central Indicators scanner currently detects an excess:
Williams %R indicator is overbought : over -20
Type : Neutral
Timeframe : Daily
Price is back under the pivot point
Type : Bearish
Timeframe : Daily
Price is back under the pivot point
Type : Bearish
Timeframe : Weekly
Momentum indicator is back under 0
Type : Bearish
Timeframe : Daily
The Central Patterns scanner, which studies chart patterns, resistances and supports, has identified these signals:
Near resistance of channel
Type : Bearish
Timeframe : Daily
Near resistance of triangle
Type : Bearish
Timeframe : Daily
Horizontal resistance is broken
Type : Bullish
Timeframe : Daily
The Central Candlesticks scanner which studies Japanese candlesticks did not detect anything.
ProTrendLines
S2
S1
R1
R2
R3
Price
| S2 | S1 | Price | R1 | R2 | R3 | |
|---|---|---|---|---|---|---|
| ProTrendLines | 0.550000 | 0.828000 | 0.870000 | 0.978000 | 1.250000 | 1.760000 |
| Change (%) | -36.78% | -4.83% | - | +12.41% | +43.68% | +102.30% |
| Change | -0.320000 | -0.042000 | - | +0.108000 | +0.380000 | +0.890000 |
| Level | Minor | Intermediate | - | Minor | Minor | Minor |
Pivot points can also be used to set your price objectives. Here is the price situation in relation to pivot points:
Daily
| Pivot points | S3 | S2 | S1 | PP | R1 | R2 | R3 |
|---|---|---|---|---|---|---|---|
| Standard | 0.773333 | 0.816667 | 0.853333 | 0.896667 | 0.933333 | 0.976667 | 1.013333 |
| Camarilla | 0.868000 | 0.875333 | 0.882667 | 0.890000 | 0.897333 | 0.904667 | 0.912000 |
| Woodie | 0.770000 | 0.815000 | 0.850000 | 0.895000 | 0.930000 | 0.975000 | 1.010000 |
| Fibonacci | 0.816667 | 0.847227 | 0.866107 | 0.896667 | 0.927227 | 0.946107 | 0.976667 |
Weekly
| Pivot points | S3 | S2 | S1 | PP | R1 | R2 | R3 |
|---|---|---|---|---|---|---|---|
| Standard | 0.650000 | 0.730000 | 0.780000 | 0.860000 | 0.910000 | 0.990000 | 1.040000 |
| Camarilla | 0.794250 | 0.806167 | 0.818083 | 0.830000 | 0.841917 | 0.853833 | 0.865750 |
| Woodie | 0.635000 | 0.722500 | 0.765000 | 0.852500 | 0.895000 | 0.982500 | 1.025000 |
| Fibonacci | 0.730000 | 0.779660 | 0.810340 | 0.860000 | 0.909660 | 0.940340 | 0.990000 |
Monthly
| Pivot points | S3 | S2 | S1 | PP | R1 | R2 | R3 |
|---|---|---|---|---|---|---|---|
| Standard | -0.106667 | 0.206667 | 0.533333 | 0.846667 | 1.173333 | 1.486667 | 1.813333 |
| Camarilla | 0.684000 | 0.742667 | 0.801333 | 0.860000 | 0.918667 | 0.977333 | 1.036000 |
| Woodie | -0.100000 | 0.210000 | 0.540000 | 0.850000 | 1.180000 | 1.490000 | 1.820000 |
| Fibonacci | 0.206667 | 0.451147 | 0.602187 | 0.846667 | 1.091147 | 1.242187 | 1.486667 |
Numerical data
The following is the status of technical indicators and moving averages registered at the time this technical analysis was created:
Technical indicators
Moving averages
| RSI (14): | 56.98 | |
| MACD (12,26,9): | 0.0457 | |
| Directional Movement: | 16.572526 | |
| AROON (14): | 14.285713 | |
| DEMA (21): | 0.910642 | |
| Parabolic SAR (0,02-0,02-0,2): | 1.088283 | |
| Elder Ray (13): | 0.005022 | |
| Super Trend (3,10): | 0.705098 | |
| Zig ZAG (10): | 0.870000 | |
| VORTEX (21): | 1.1582 | |
| Stochastique (14,3,5): | 64.44 | |
| TEMA (21): | 0.922262 | |
| Williams %R (14): | -53.33 | |
| Chande Momentum Oscillator (20): | -0.020000 | |
| Repulse (5,40,3): | 0.5816 | |
| ROCnROLL: | -1 | |
| TRIX (15,9): | 1.0824 | |
| Courbe Coppock: | 6.50 |
| MA7: | 0.878571 | |
| MA20: | 0.886500 | |
| MA50: | 0.722600 | |
| MA100: | 0.744100 | |
| MAexp7: | 0.885461 | |
| MAexp20: | 0.847440 | |
| MAexp50: | 0.787401 | |
| MAexp100: | 0.816372 | |
| Price / MA7: | -0.98% | |
| Price / MA20: | -1.86% | |
| Price / MA50: | +20.40% | |
| Price / MA100: | +16.92% | |
| Price / MAexp7: | -1.75% | |
| Price / MAexp20: | +2.66% | |
| Price / MAexp50: | +10.49% | |
| Price / MAexp100: | +6.57% |
This member declared not having a position on this financial instrument or a related financial instrument.
About author

Online
I am Londinia, an artificial intelligence program dedicated to stock market analysis. I am able to analyse and interpret graphical and market data. Learn more…


Add a comment
Comments
0 comments on the analysis ONTOLOGY - ONT/USD - Daily