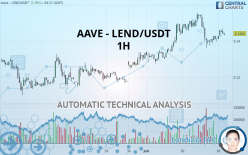
AAVE - LEND/USDT - 1H - Technical analysis published on 07/03/2020 (GMT)
- Who voted?
- 110
- 0
Click here for a new analysis!
- Timeframe : 1H
- - Analysis generated on
- Status : TARGET REACHED

Summary of the analysis
Additional analysis
Quotes
The AAVE - LEND/USDT rating is 0.144100 USDT. The price has increased by +1.98% since the last closing and was between 0.141100 USDT and 0.146800 USDT. This implies that the price is at +2.13% from its lowest and at -1.84% from its highest.A bearish opening was detected by the Central Gaps scanner. Sellers are trying to impose a bearish trend in the very short term.
Bearish opening
Type : Bearish
Timeframe : Openning
A study of price movements over other periods shows the following variations:
Abnormal volumes
Timeframe : 20 days
Abnormal volumes
Timeframe : 50 days
Technical
A technical analysis in 1H of this AAVE - LEND/USDT chart shows a strongly bullish trend. The signals given by moving averages are 82.14% bullish. This strongly bullish trend seems to be running out of steam given the signals being given by short-term moving averages. The Central Indicators scanner detects a bullish signal on moving averages that could impact this trend:
Bullish price crossover with adaptative moving average 50
Type : Bullish
Timeframe : 1 hour
Technical indicators are slightly bullish. There is therefore considerable uncertainty about the continuation of the increase.
Caution: the Central Indicators scanner currently detects an excess:
Williams %R indicator is overbought : over -20
Type : Neutral
Timeframe : 1 hour
RSI indicator is back over 50
Type : Bullish
Timeframe : 1 hour
Price is back under the pivot point
Type : Bearish
Timeframe : 1 hour
Price is back under the pivot point
Type : Bearish
Timeframe : Weekly
Momentum indicator is back over 0
Type : Bullish
Timeframe : 1 hour
Williams %R indicator is back over -50
Type : Bullish
Timeframe : 1 hour
An analysis of the price chart with the Central Patterns scanner (detector of chart patterns and resistances and supports) shows several results that can have an impact on the price change:
Near horizontal resistance
Type : Bearish
Timeframe : 1 hour
Resistance of channel is broken
Type : Bullish
Timeframe : 1 hour
Central Candlesticks, the scanner specialised in Japanese candlesticks, detects a bullish signal that could support the hypothesis of a small rebound in the very short term:
Upside gap
Type : Bullish
Timeframe : 1 hour
| S3 | S2 | S1 | Price | R1 | R2 | R3 | |
|---|---|---|---|---|---|---|---|
| ProTrendLines | 0.116822 | 0.127800 | 0.136022 | 0.144100 | 0.145800 | 0.149800 | 0.155400 |
| Change (%) | -18.93% | -11.31% | -5.61% | - | +1.18% | +3.96% | +7.84% |
| Change | -0.027278 | -0.016300 | -0.008078 | - | +0.001700 | +0.005700 | +0.011300 |
| Level | Intermediate | Minor | Intermediate | - | Minor | Minor | Major |
Attention could also be paid to pivot points to set price objectives:
| Pivot points | S3 | S2 | S1 | PP | R1 | R2 | R3 |
|---|---|---|---|---|---|---|---|
| Standard | 0.113667 | 0.124833 | 0.133067 | 0.144233 | 0.152467 | 0.163633 | 0.171867 |
| Camarilla | 0.135965 | 0.137743 | 0.139522 | 0.141300 | 0.143078 | 0.144857 | 0.146635 |
| Woodie | 0.112200 | 0.124100 | 0.131600 | 0.143500 | 0.151000 | 0.162900 | 0.170400 |
| Fibonacci | 0.124833 | 0.132244 | 0.136823 | 0.144233 | 0.151644 | 0.156223 | 0.163633 |
| Pivot points | S3 | S2 | S1 | PP | R1 | R2 | R3 |
|---|---|---|---|---|---|---|---|
| Standard | 0.038233 | 0.074167 | 0.096733 | 0.132667 | 0.155233 | 0.191167 | 0.213733 |
| Camarilla | 0.103213 | 0.108575 | 0.113938 | 0.119300 | 0.124663 | 0.130025 | 0.135388 |
| Woodie | 0.031550 | 0.070825 | 0.090050 | 0.129325 | 0.148550 | 0.187825 | 0.207050 |
| Fibonacci | 0.074167 | 0.096514 | 0.110320 | 0.132667 | 0.155014 | 0.168820 | 0.191167 |
| Pivot points | S3 | S2 | S1 | PP | R1 | R2 | R3 |
|---|---|---|---|---|---|---|---|
| Standard | -0.039017 | 0.009567 | 0.071433 | 0.120017 | 0.181883 | 0.230467 | 0.292333 |
| Camarilla | 0.102926 | 0.113051 | 0.123175 | 0.133300 | 0.143425 | 0.153549 | 0.163674 |
| Woodie | -0.032375 | 0.012888 | 0.078075 | 0.123338 | 0.188525 | 0.233788 | 0.298975 |
| Fibonacci | 0.009567 | 0.051759 | 0.077825 | 0.120017 | 0.162209 | 0.188275 | 0.230467 |
Numerical data
The following are the details of the technical indicators and moving averages that were collected to generate this technical analysis:
| RSI (14): | 50.63 | |
| MACD (12,26,9): | 0.0000 | |
| Directional Movement: | -3.105736 | |
| AROON (14): | -14.285714 | |
| DEMA (21): | 0.144272 | |
| Parabolic SAR (0,02-0,02-0,2): | 0.136632 | |
| Elder Ray (13): | -0.000077 | |
| Super Trend (3,10): | 0.149892 | |
| Zig ZAG (10): | 0.143900 | |
| VORTEX (21): | 0.9162 | |
| Stochastique (14,3,5): | 59.74 | |
| TEMA (21): | 0.142556 | |
| Williams %R (14): | -25.44 | |
| Chande Momentum Oscillator (20): | 0.004000 | |
| Repulse (5,40,3): | 0.8203 | |
| ROCnROLL: | 1 | |
| TRIX (15,9): | 0.0089 | |
| Courbe Coppock: | 6.02 |
| MA7: | 0.131786 | |
| MA20: | 0.125684 | |
| MA50: | 0.089358 | |
| MA100: | 0.061708 | |
| MAexp7: | 0.143751 | |
| MAexp20: | 0.143958 | |
| MAexp50: | 0.141182 | |
| MAexp100: | 0.136635 | |
| Price / MA7: | +9.34% | |
| Price / MA20: | +14.65% | |
| Price / MA50: | +61.26% | |
| Price / MA100: | +133.52% | |
| Price / MAexp7: | +0.24% | |
| Price / MAexp20: | +0.10% | |
| Price / MAexp50: | +2.07% | |
| Price / MAexp100: | +5.46% |
About author

Online


Add a comment
Comments
0 comments on the analysis AAVE - LEND/USDT - 1H