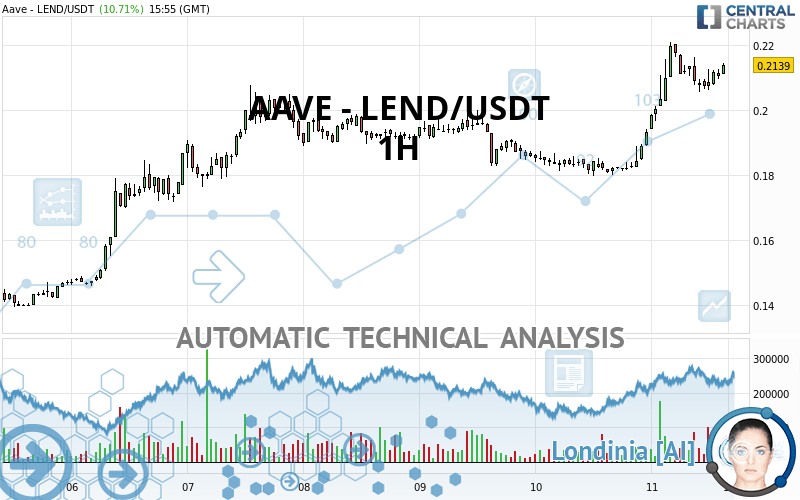
AAVE - LEND/USDT - 1H - Technical analysis published on 07/11/2020 (GMT)
- Who voted?
- 117
- 0
- Timeframe : 1H
- - Analysis generated on
- Status : WITHOUT TARGET

Summary of the analysis
Additional analysis
Quotes
The AAVE - LEND/USDT price is 0.213900 USDT. On the day, this instrument gained +10.71% and was traded between 0.194100 USDT and 0.221000 USDT over the period. The price is currently at +10.20% from its lowest and -3.21% from its highest.The Central Gaps scanner detects a bullish opening marking the presence of buyers ahead of sellers at the opening but not sufficiently marked to allow the price to register a quotation gap.
Bullish opening
Type : Bullish
Timeframe : Openning
A study of price movements over other periods shows the following variations:
New HIGH record (1 year)
Type : Bullish
Timeframe : Weekly
New HIGH record (1st january)
Type : Bullish
Timeframe : Weekly
New HIGH record (1 month)
Type : Bullish
Timeframe : Weekly
The Central Volumes scanner notes the presence of abnormal volumes:
Abnormal volumes
Timeframe : 5 days
Abnormal volumes
Timeframe : 20 days
Abnormal volumes
Timeframe : 50 days
Technical
Technical analysis of this 1H chart of AAVE - LEND/USDT indicates that the overall trend is strongly bullish. The signals given by the moving averages are 89.29% bullish. This strong bullish trend is confirmed by the strong signals currently being given by short-term moving averages. The Central Indicators market scanner currently does not detect any result that concerns moving averages.
The probability of a further increase are moderate given the direction of the technical indicators.
Other results related to technical indicators were also found by the Central Indicators scanner:
Pivot points : price is over resistance 2
Type : Neutral
Timeframe : 1 hour
Pivot points : price is over resistance 3
Type : Neutral
Timeframe : Weekly
MACD crosses DOWN its Moving Average
Type : Bearish
Timeframe : 1 hour
An analysis of the price chart with the Central Patterns scanner (detector of chart patterns and resistances and supports) shows several results that can have an impact on the price change:
Near horizontal support
Type : Bullish
Timeframe : 1 hour
Support of channel is broken
Type : Bearish
Timeframe : 1 hour
Support of triangle is broken
Type : Bearish
Timeframe : 1 hour
No result was found by the Central Candlesticks scanner on Japanese candlesticks.
| S3 | S2 | S1 | Price | |
|---|---|---|---|---|
| ProTrendLines | 0.190733 | 0.200700 | 0.207700 | 0.213900 |
| Change (%) | -10.83% | -6.17% | -2.90% | - |
| Change | -0.023167 | -0.013200 | -0.006200 | - |
| Level | Minor | Minor | Intermediate | - |
Pivot points can also be used to set your price objectives. Here is the price situation in relation to pivot points:
| Pivot points | S3 | S2 | S1 | PP | R1 | R2 | R3 |
|---|---|---|---|---|---|---|---|
| Standard | 0.169333 | 0.174467 | 0.183833 | 0.188967 | 0.198333 | 0.203467 | 0.212833 |
| Camarilla | 0.189213 | 0.190542 | 0.191871 | 0.193200 | 0.194529 | 0.195858 | 0.197188 |
| Woodie | 0.171450 | 0.175525 | 0.185950 | 0.190025 | 0.200450 | 0.204525 | 0.214950 |
| Fibonacci | 0.174467 | 0.180006 | 0.183428 | 0.188967 | 0.194506 | 0.197928 | 0.203467 |
| Pivot points | S3 | S2 | S1 | PP | R1 | R2 | R3 |
|---|---|---|---|---|---|---|---|
| Standard | 0.083800 | 0.099200 | 0.124600 | 0.140000 | 0.165400 | 0.180800 | 0.206200 |
| Camarilla | 0.138780 | 0.142520 | 0.146260 | 0.150000 | 0.153740 | 0.157480 | 0.161220 |
| Woodie | 0.088800 | 0.101700 | 0.129600 | 0.142500 | 0.170400 | 0.183300 | 0.211200 |
| Fibonacci | 0.099200 | 0.114786 | 0.124414 | 0.140000 | 0.155586 | 0.165214 | 0.180800 |
| Pivot points | S3 | S2 | S1 | PP | R1 | R2 | R3 |
|---|---|---|---|---|---|---|---|
| Standard | -0.039017 | 0.009567 | 0.071433 | 0.120017 | 0.181883 | 0.230467 | 0.292333 |
| Camarilla | 0.102926 | 0.113051 | 0.123175 | 0.133300 | 0.143425 | 0.153549 | 0.163674 |
| Woodie | -0.032375 | 0.012888 | 0.078075 | 0.123338 | 0.188525 | 0.233788 | 0.298975 |
| Fibonacci | 0.009567 | 0.051759 | 0.077825 | 0.120017 | 0.162209 | 0.188275 | 0.230467 |
Numerical data
The following is the status of technical indicators and moving averages registered at the time this technical analysis was created:
| RSI (14): | 66.15 | |
| MACD (12,26,9): | 0.0058 | |
| Directional Movement: | 20.387886 | |
| AROON (14): | 21.428572 | |
| DEMA (21): | 0.212940 | |
| Parabolic SAR (0,02-0,02-0,2): | 0.217923 | |
| Elder Ray (13): | 0.003436 | |
| Super Trend (3,10): | 0.201518 | |
| Zig ZAG (10): | 0.212700 | |
| VORTEX (21): | 1.2302 | |
| Stochastique (14,3,5): | 61.76 | |
| TEMA (21): | 0.215575 | |
| Williams %R (14): | -44.39 | |
| Chande Momentum Oscillator (20): | 0.002300 | |
| Repulse (5,40,3): | 1.0375 | |
| ROCnROLL: | 1 | |
| TRIX (15,9): | 0.4732 | |
| Courbe Coppock: | 14.63 |
| MA7: | 0.187071 | |
| MA20: | 0.152725 | |
| MA50: | 0.108854 | |
| MA100: | 0.074640 | |
| MAexp7: | 0.210667 | |
| MAexp20: | 0.205208 | |
| MAexp50: | 0.197459 | |
| MAexp100: | 0.190491 | |
| Price / MA7: | +14.34% | |
| Price / MA20: | +40.06% | |
| Price / MA50: | +96.50% | |
| Price / MA100: | +186.58% | |
| Price / MAexp7: | +1.53% | |
| Price / MAexp20: | +4.24% | |
| Price / MAexp50: | +8.33% | |
| Price / MAexp100: | +12.29% |
About author

Online


Add a comment
Comments
0 comments on the analysis AAVE - LEND/USDT - 1H