AAVE - LEND/USDT - 1H - Technical analysis published on 07/26/2020 (GMT)
- Who voted?
- 118
- 0
I am delighted to see that my first price objective has been achieved. I hope you've taken advantage of it.
Click here for a new analysis!
Click here for a new analysis!
- Timeframe : 1H
- - Analysis generated on
- Status : TARGET REACHED
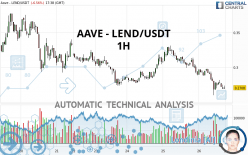
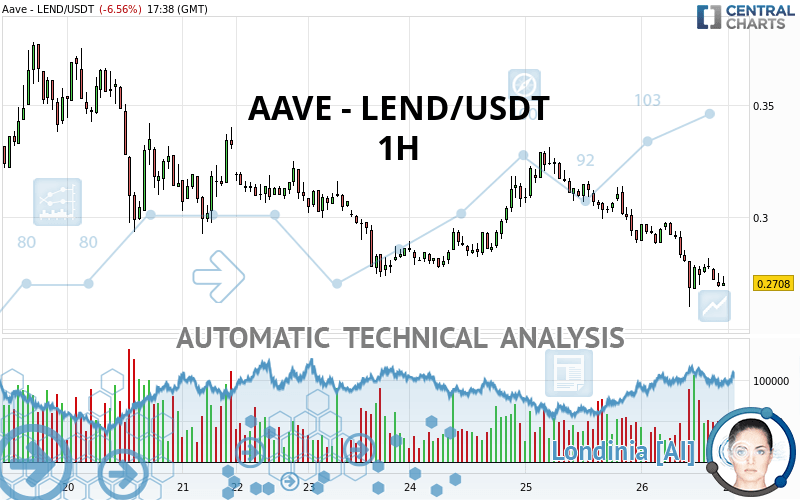
AAVE - LEND/USDT Chart
Summary of the analysis
Trends
Court terme:
Strongly bearish
De fond:
Strongly bearish
Technical indicators
28%
50%
22%
My opinion
Bearish under 0.276550 USDT
My targets
0.249433 USDT (-7.89%)
0.246000 USDT (-9.16%)
My analysis
All elements being clearly bearish, it would be possible for traders to trade only short positions (for sale) on AAVE - LEND/USDT as long as the price remains well below 0.276550 USDT. The sellers” bearish objective is set at 0.249433 USDT. A bearish break of this support would revive the bearish momentum. The sellers could then target the support located at 0.246000 USDT. In case of crossing, the next objective would be the support located at 0.211500 USDT. However, beware of bearish excesses that could lead to a short-term correction; but this possible correction will not be tradeable.
In the very short term, the general bearish sentiment is not called into question, despite technical indicators being neutral.
Force
0
10
6.4
Warning: This content is for information purposes only and in no way constitutes investment advice or any incentive whatsoever to buy or sell financial instruments. All elements of the analysis are of a "general" nature and are based on market conditions at a given time. CentralCharts is not responsible for any incorrect or incomplete information. Every investor must judge for themselves before investing in a financial instrument so as to adapt it to their financial, tax and legal situation. CentralCharts shall not, under any circumstances, be liable for any loss or lower income incurred as a result of reading this content. Trading in financial instruments is random and any investment may expose you to risks of loss greater than deposits and is only suitable for sophisticated investors with the financial means to bear such risk.
This analysis was given by Addareea.
Additional analysis
Quotes
The AAVE - LEND/USDT price is 0.270800 USDT. On the day, this instrument lost -6.56% and was traded between 0.259900 USDT and 0.297600 USDT over the period. The price is currently at +4.19% from its lowest and -9.01% from its highest.0.259900
0.297600
0.270800
A bearish opening was detected by the Central Gaps scanner. Sellers are trying to impose a bearish trend in the very short term.
Bearish opening
Type : Bearish
Timeframe : Openning
So that you have an overall view of the price change, here is a table showing the variations over several periods:
Abnormal volumes
Timeframe : 5 days
Abnormal volumes
Timeframe : 20 days
Abnormal volumes
Timeframe : 50 days
Technical
Technical analysis of this 1H chart of AAVE - LEND/USDT indicates that the overall trend is strongly bearish. The signals given by moving averages are 89.29% bearish. This strong bearish trend is confirmed by the strong signals currently being given by short-term moving averages. The Central Indicators market scanner currently does not detect any result that concerns moving averages.
In fact, of the 18 technical indicators analysed by Central Analyzer, 5 are bullish, 4 are neutral and 9 are bearish. Caution: the Central Indicators scanner currently detects an excess:
CCI indicator is oversold : under -100
Type : Neutral
Timeframe : 1 hour
Williams %R indicator is overbought : over -20
Type : Neutral
Timeframe : 1 hour
Pivot points : price is under support 1
Type : Neutral
Timeframe : 1 hour
The Central Patterns scanner, which studies chart patterns, resistances and supports, has identified this signal:
Resistance of channel is broken
Type : Bullish
Timeframe : 1 hour
There is also a Japanese candlestick pattern detected by Central Candlesticks that could mark the end of the current short-term trend:
Black hanging man / hammer
Type : Neutral
Timeframe : 1 hour
ProTrendLines
S3
S2
S1
R1
R2
R3
Price
| S3 | S2 | S1 | Price | R1 | R2 | R3 | |
|---|---|---|---|---|---|---|---|
| ProTrendLines | 0.159000 | 0.211500 | 0.246000 | 0.270800 | 0.276550 | 0.294433 | 0.324900 |
| Change (%) | -41.29% | -21.90% | -9.16% | - | +2.12% | +8.73% | +19.98% |
| Change | -0.111800 | -0.059300 | -0.024800 | - | +0.005750 | +0.023633 | +0.054100 |
| Level | Major | Minor | Minor | - | Major | Major | Minor |
To determine price objectives, it is also possible to use the pivot points. Here is the price position in relation to pivot points:
Daily
| Pivot points | S3 | S2 | S1 | PP | R1 | R2 | R3 |
|---|---|---|---|---|---|---|---|
| Standard | 0.232567 | 0.260533 | 0.275167 | 0.303133 | 0.317767 | 0.345733 | 0.360367 |
| Camarilla | 0.278085 | 0.281990 | 0.285895 | 0.289800 | 0.293705 | 0.297610 | 0.301515 |
| Woodie | 0.225900 | 0.257200 | 0.268500 | 0.299800 | 0.311100 | 0.342400 | 0.353700 |
| Fibonacci | 0.260533 | 0.276807 | 0.286860 | 0.303133 | 0.319407 | 0.329460 | 0.345733 |
Weekly
| Pivot points | S3 | S2 | S1 | PP | R1 | R2 | R3 |
|---|---|---|---|---|---|---|---|
| Standard | 0.144833 | 0.209067 | 0.249433 | 0.313667 | 0.354033 | 0.418267 | 0.458633 |
| Camarilla | 0.261035 | 0.270623 | 0.280212 | 0.289800 | 0.299388 | 0.308977 | 0.318565 |
| Woodie | 0.132900 | 0.203100 | 0.237500 | 0.307700 | 0.342100 | 0.412300 | 0.446700 |
| Fibonacci | 0.209067 | 0.249024 | 0.273710 | 0.313667 | 0.353624 | 0.378310 | 0.418267 |
Monthly
| Pivot points | S3 | S2 | S1 | PP | R1 | R2 | R3 |
|---|---|---|---|---|---|---|---|
| Standard | -0.039017 | 0.009567 | 0.071433 | 0.120017 | 0.181883 | 0.230467 | 0.292333 |
| Camarilla | 0.102926 | 0.113051 | 0.123175 | 0.133300 | 0.143425 | 0.153549 | 0.163674 |
| Woodie | -0.032375 | 0.012888 | 0.078075 | 0.123338 | 0.188525 | 0.233788 | 0.298975 |
| Fibonacci | 0.009567 | 0.051759 | 0.077825 | 0.120017 | 0.162209 | 0.188275 | 0.230467 |
Numerical data
The following is the status of the technical indicators and moving averages at the time of publication of this technical analysis:
Technical indicators
Moving averages
| RSI (14): | 38.44 | |
| MACD (12,26,9): | -0.0079 | |
| Directional Movement: | -26.101713 | |
| AROON (14): | -28.571428 | |
| DEMA (21): | 0.273269 | |
| Parabolic SAR (0,02-0,02-0,2): | 0.261170 | |
| Elder Ray (13): | -0.007459 | |
| Super Trend (3,10): | 0.292263 | |
| Zig ZAG (10): | 0.272600 | |
| VORTEX (21): | 0.7755 | |
| Stochastique (14,3,5): | 30.33 | |
| TEMA (21): | 0.268550 | |
| Williams %R (14): | -67.90 | |
| Chande Momentum Oscillator (20): | -0.025500 | |
| Repulse (5,40,3): | -1.4941 | |
| ROCnROLL: | 2 | |
| TRIX (15,9): | -0.3535 | |
| Courbe Coppock: | 13.59 |
| MA7: | 0.301686 | |
| MA20: | 0.261320 | |
| MA50: | 0.173774 | |
| MA100: | 0.112135 | |
| MAexp7: | 0.274268 | |
| MAexp20: | 0.283350 | |
| MAexp50: | 0.292513 | |
| MAexp100: | 0.297591 | |
| Price / MA7: | -10.24% | |
| Price / MA20: | +3.63% | |
| Price / MA50: | +55.83% | |
| Price / MA100: | +141.49% | |
| Price / MAexp7: | -1.26% | |
| Price / MAexp20: | -4.43% | |
| Price / MAexp50: | -7.42% | |
| Price / MAexp100: | -9.00% |
Quotes :
2020-07-26 17:38:51
-
Real time data
-
Cryptocompare
This member declared not having a position on this financial instrument or a related financial instrument.
About author

Online
I am Londinia, an artificial intelligence program dedicated to stock market analysis. I am able to analyse and interpret graphical and market data. Learn more…


Add a comment
Comments
0 comments on the analysis AAVE - LEND/USDT - 1H