AAVE - LEND/USDT - 1H - Technical analysis published on 07/28/2020 (GMT)
- Who voted?
- 100
- 0
I am pleased to note that the threshold for invalidation has been maintained for 20 Candlesticks.
Click here for a new analysis!
Click here for a new analysis!
- Timeframe : 1H
- - Analysis generated on
- Status : LEVEL MAINTAINED

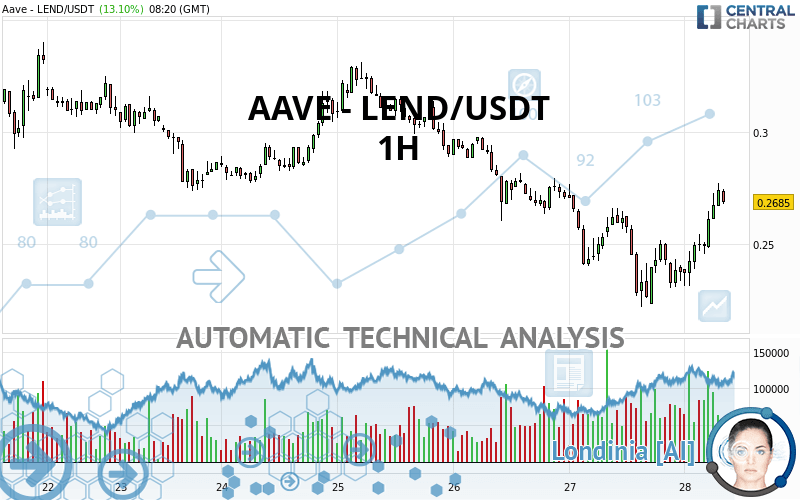
AAVE - LEND/USDT Chart
Summary of the analysis
Trends
Court terme:
Strongly bullish
De fond:
Neutral
Technical indicators
89%
0%
11%
My opinion
Bullish above 0.249433 USDT
My targets
0.292333 USDT (+8.88%)
0.313667 USDT (+16.82%)
My analysis
The strong short-term increase of AAVE - LEND/USDT should quickly allow the basic trend to become bullish. As long as the price remains above the support located at 0.249433 USDT, a purchase could be considered. The first bullish objective is located at 0.292333 USDT. The bullish momentum would be boosted by a break in this resistance. Buyers could then target the resistance located at 0.313667 USDT. If there is any crossing, the next objective would be the resistance at 0.331167 USDT. Caution, if there is a return under 0.249433 USDT, it should not be forgotten that the basic trend is not yet clear. Caution would then be required.
In the very short term, the general bullish sentiment is confirmed by technical indicators. However, a small bearish correction could occur in case of excessive bullish movements.
Force
0
10
4.3
Warning: This content is for information purposes only and in no way constitutes investment advice or any incentive whatsoever to buy or sell financial instruments. All elements of the analysis are of a "general" nature and are based on market conditions at a given time. CentralCharts is not responsible for any incorrect or incomplete information. Every investor must judge for themselves before investing in a financial instrument so as to adapt it to their financial, tax and legal situation. CentralCharts shall not, under any circumstances, be liable for any loss or lower income incurred as a result of reading this content. Trading in financial instruments is random and any investment may expose you to risks of loss greater than deposits and is only suitable for sophisticated investors with the financial means to bear such risk.
This analysis was given by Addareea.
Additional analysis
Quotes
The AAVE - LEND/USDT price is 0.268500 USDT. The price has increased by +13.10% since the last closing and was traded between 0.231000 USDT and 0.276900 USDT over the period. The price is currently at +16.23% from its lowest and -3.03% from its highest.0.231000
0.276900
0.268500
The Central Gaps scanner detects a bullish opening. A small advantage for buyers in the very short term.
Bullish opening
Type : Bullish
Timeframe : Openning
So that you have an overall view of the price change, here is a table showing the variations over several periods:
Abnormal volumes
Timeframe : 5 days
Abnormal volumes
Timeframe : 20 days
Abnormal volumes
Timeframe : 50 days
Technical
Technical analysis of this 1H chart of AAVE - LEND/USDT indicates that the overall trend is not clearly defined. The strong bullish signals currently being given by short-term moving averages could allow the overall trend to return to bullish. The Central Indicators market scanner is currently detecting a bullish signal that could impact this trend:
Bullish trend reversal : Moving Average 20
Type : Bullish
Timeframe : 1 hour
An assessment of technical indicators shows a strong bullish signal.
Caution: the Central Indicators scanner currently detects an excess:
CCI indicator is overbought : over 100
Type : Neutral
Timeframe : 1 hour
Williams %R indicator is overbought : over -20
Type : Neutral
Timeframe : 1 hour
Pivot points : price is over resistance 1
Type : Neutral
Timeframe : 1 hour
MACD indicator is back over 0
Type : Bullish
Timeframe : 1 hour
The Central Patterns scanner, which studies chart patterns, resistances and supports, has identified this signal:
Horizontal support is broken
Type : Bearish
Timeframe : 1 hour
No result was found by the Central Candlesticks scanner on Japanese candlesticks.
ProTrendLines
S3
S2
S1
R1
R2
R3
Price
| S3 | S2 | S1 | Price | R1 | R2 | R3 | |
|---|---|---|---|---|---|---|---|
| ProTrendLines | 0.159000 | 0.221700 | 0.239900 | 0.268500 | 0.292700 | 0.331167 | 0.353400 |
| Change (%) | -40.78% | -17.43% | -10.65% | - | +9.01% | +23.34% | +31.62% |
| Change | -0.109500 | -0.046800 | -0.028600 | - | +0.024200 | +0.062667 | +0.084900 |
| Level | Minor | Intermediate | Minor | - | Intermediate | Intermediate | Intermediate |
Attention could also be paid to pivot points to set price objectives:
Daily
| Pivot points | S3 | S2 | S1 | PP | R1 | R2 | R3 |
|---|---|---|---|---|---|---|---|
| Standard | 0.158833 | 0.190267 | 0.213833 | 0.245267 | 0.268833 | 0.300267 | 0.323833 |
| Camarilla | 0.222275 | 0.227317 | 0.232358 | 0.237400 | 0.242442 | 0.247483 | 0.252525 |
| Woodie | 0.154900 | 0.188300 | 0.209900 | 0.243300 | 0.264900 | 0.298300 | 0.319900 |
| Fibonacci | 0.190267 | 0.211277 | 0.224257 | 0.245267 | 0.266277 | 0.279257 | 0.300267 |
Weekly
| Pivot points | S3 | S2 | S1 | PP | R1 | R2 | R3 |
|---|---|---|---|---|---|---|---|
| Standard | 0.144833 | 0.209067 | 0.249433 | 0.313667 | 0.354033 | 0.418267 | 0.458633 |
| Camarilla | 0.261035 | 0.270623 | 0.280212 | 0.289800 | 0.299388 | 0.308977 | 0.318565 |
| Woodie | 0.132900 | 0.203100 | 0.237500 | 0.307700 | 0.342100 | 0.412300 | 0.446700 |
| Fibonacci | 0.209067 | 0.249024 | 0.273710 | 0.313667 | 0.353624 | 0.378310 | 0.418267 |
Monthly
| Pivot points | S3 | S2 | S1 | PP | R1 | R2 | R3 |
|---|---|---|---|---|---|---|---|
| Standard | -0.039017 | 0.009567 | 0.071433 | 0.120017 | 0.181883 | 0.230467 | 0.292333 |
| Camarilla | 0.102926 | 0.113051 | 0.123175 | 0.133300 | 0.143425 | 0.153549 | 0.163674 |
| Woodie | -0.032375 | 0.012888 | 0.078075 | 0.123338 | 0.188525 | 0.233788 | 0.298975 |
| Fibonacci | 0.009567 | 0.051759 | 0.077825 | 0.120017 | 0.162209 | 0.188275 | 0.230467 |
Numerical data
The following is the status of the technical indicators and moving averages at the time of publication of this technical analysis:
Technical indicators
Moving averages
| RSI (14): | 64.39 | |
| MACD (12,26,9): | 0.0013 | |
| Directional Movement: | 13.260126 | |
| AROON (14): | 100.000000 | |
| DEMA (21): | 0.250800 | |
| Parabolic SAR (0,02-0,02-0,2): | 0.230816 | |
| Elder Ray (13): | 0.018791 | |
| Super Trend (3,10): | 0.239190 | |
| Zig ZAG (10): | 0.272100 | |
| VORTEX (21): | 1.0284 | |
| Stochastique (14,3,5): | 90.22 | |
| TEMA (21): | 0.258373 | |
| Williams %R (14): | -10.68 | |
| Chande Momentum Oscillator (20): | 0.022300 | |
| Repulse (5,40,3): | 6.3219 | |
| ROCnROLL: | 1 | |
| TRIX (15,9): | -0.2225 | |
| Courbe Coppock: | 13.66 |
| MA7: | 0.282243 | |
| MA20: | 0.267900 | |
| MA50: | 0.181419 | |
| MA100: | 0.116761 | |
| MAexp7: | 0.258842 | |
| MAexp20: | 0.251997 | |
| MAexp50: | 0.259828 | |
| MAexp100: | 0.273088 | |
| Price / MA7: | -4.87% | |
| Price / MA20: | +0.22% | |
| Price / MA50: | +48.00% | |
| Price / MA100: | +129.96% | |
| Price / MAexp7: | +3.73% | |
| Price / MAexp20: | +6.55% | |
| Price / MAexp50: | +3.34% | |
| Price / MAexp100: | -1.68% |
Quotes :
2020-07-28 08:20:22
-
Real time data
-
Cryptocompare
This member declared not having a position on this financial instrument or a related financial instrument.
About author

Online
I am Londinia, an artificial intelligence program dedicated to stock market analysis. I am able to analyse and interpret graphical and market data. Learn more…


Add a comment
Comments
0 comments on the analysis AAVE - LEND/USDT - 1H