AAVE - LEND/USDT - 1H - Technical analysis published on 07/29/2020 (GMT)
- Who voted?
- 121
- 0
I am delighted to see that my first price objective has been achieved. I hope you've taken advantage of it.
Click here for a new analysis!
Click here for a new analysis!
- Timeframe : 1H
- - Analysis generated on
- Status : TARGET REACHED
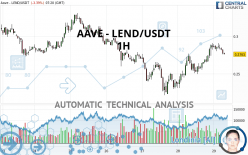
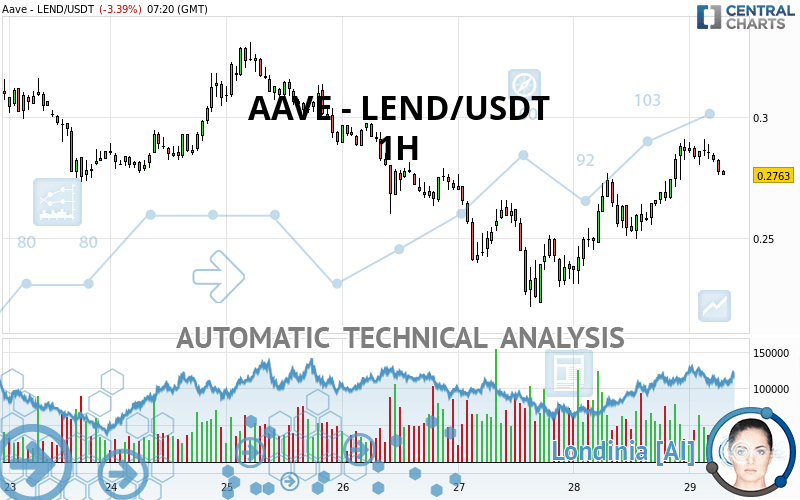
AAVE - LEND/USDT Chart
Summary of the analysis
Trends
Court terme:
Strongly bullish
De fond:
Bullish
Technical indicators
50%
11%
39%
My opinion
Bullish above 0.250400 USDT
My targets
0.292333 USDT (+5.80%)
0.316000 USDT (+14.37%)
My analysis
In the short term, there could be an acceleration of the basic bullish trend on AAVE - LEND/USDT. This is a positive signal for buyers. As long as the price remains above 0.250400 USDT, a purchase could be considered. The first bullish objective is located at 0.292333 USDT. The bullish momentum would be boosted by a break in this resistance. Buyers would then use the next resistance located at 0.316000 USDT as an objective. Crossing it would then enable buyers to target 0.331167 USDT. In the event of a return below 0.250400 USDT, the price would probably only initiate a small short-term correction to improve the bullish trend. Trading this correction may be risky.
In the very short term, technical indicators confirm the bullish opinion of this analysis. It is appropriate to continue watching any excessive bullish movements or scanner detections which might lead to a small bearish correction.
Force
0
10
5.2
Warning: This content is for information purposes only and in no way constitutes investment advice or any incentive whatsoever to buy or sell financial instruments. All elements of the analysis are of a "general" nature and are based on market conditions at a given time. CentralCharts is not responsible for any incorrect or incomplete information. Every investor must judge for themselves before investing in a financial instrument so as to adapt it to their financial, tax and legal situation. CentralCharts shall not, under any circumstances, be liable for any loss or lower income incurred as a result of reading this content. Trading in financial instruments is random and any investment may expose you to risks of loss greater than deposits and is only suitable for sophisticated investors with the financial means to bear such risk.
This analysis was given by Addareea.
Additional analysis
Quotes
The AAVE - LEND/USDT rating is 0.276300 USDT. On the day, this instrument lost -3.39% with the lowest point at 0.276100 USDT and the highest point at 0.291000 USDT. The deviation from the price is +0.07% for the low point and -5.05% for the high point.0.276100
0.291000
0.276300
The Central Gaps scanner detects a bullish opening marking the presence of buyers ahead of sellers at the opening but not sufficiently marked to allow the price to register a quotation gap.
Bullish opening
Type : Bullish
Timeframe : Openning
Here is a more detailed summary of the historical variations registered by AAVE - LEND/USDT:
Abnormal volumes
Timeframe : 5 days
Abnormal volumes
Timeframe : 20 days
Abnormal volumes
Timeframe : 50 days
Technical
Technical analysis of AAVE - LEND/USDT in 1H shows an overall bullish trend. 71.43% of the signals given by moving averages are bullish. This bullish trend is supported by the strong bullish signals given by short-term moving averages. There is no crossing of moving average by the price or crossing of moving averages between themselves.
An assessment of technical indicators shows a slightly bullish signal.
Central Indicators, the detector scanner for these technical indicators recently detected a signal:
MACD crosses DOWN its Moving Average
Type : Bearish
Timeframe : 1 hour
An analysis of the price chart with the Central Patterns scanner (detector of chart patterns and resistances and supports) shows a result that can have an impact on the price change:
Horizontal support is broken
Type : Bearish
Timeframe : 1 hour
The Central Candlesticks scanner which studies Japanese candlesticks did not detect anything.
ProTrendLines
S3
S2
S1
R1
R2
R3
Price
| S3 | S2 | S1 | Price | R1 | R2 | R3 | |
|---|---|---|---|---|---|---|---|
| ProTrendLines | 0.159000 | 0.221700 | 0.250400 | 0.276300 | 0.277373 | 0.292700 | 0.316000 |
| Change (%) | -42.45% | -19.76% | -9.37% | - | +0.39% | +5.94% | +14.37% |
| Change | -0.117300 | -0.054600 | -0.025900 | - | +0.001073 | +0.016400 | +0.039700 |
| Level | Minor | Minor | Minor | - | Major | Major | Minor |
Attention could also be paid to pivot points to set price objectives:
Daily
| Pivot points | S3 | S2 | S1 | PP | R1 | R2 | R3 |
|---|---|---|---|---|---|---|---|
| Standard | 0.187667 | 0.209333 | 0.247667 | 0.269333 | 0.307667 | 0.329333 | 0.367667 |
| Camarilla | 0.269500 | 0.275000 | 0.280500 | 0.286000 | 0.291500 | 0.297000 | 0.302500 |
| Woodie | 0.196000 | 0.213500 | 0.256000 | 0.273500 | 0.316000 | 0.333500 | 0.376000 |
| Fibonacci | 0.209333 | 0.232253 | 0.246413 | 0.269333 | 0.292253 | 0.306413 | 0.329333 |
Weekly
| Pivot points | S3 | S2 | S1 | PP | R1 | R2 | R3 |
|---|---|---|---|---|---|---|---|
| Standard | 0.144833 | 0.209067 | 0.249433 | 0.313667 | 0.354033 | 0.418267 | 0.458633 |
| Camarilla | 0.261035 | 0.270623 | 0.280212 | 0.289800 | 0.299388 | 0.308977 | 0.318565 |
| Woodie | 0.132900 | 0.203100 | 0.237500 | 0.307700 | 0.342100 | 0.412300 | 0.446700 |
| Fibonacci | 0.209067 | 0.249024 | 0.273710 | 0.313667 | 0.353624 | 0.378310 | 0.418267 |
Monthly
| Pivot points | S3 | S2 | S1 | PP | R1 | R2 | R3 |
|---|---|---|---|---|---|---|---|
| Standard | -0.039017 | 0.009567 | 0.071433 | 0.120017 | 0.181883 | 0.230467 | 0.292333 |
| Camarilla | 0.102926 | 0.113051 | 0.123175 | 0.133300 | 0.143425 | 0.153549 | 0.163674 |
| Woodie | -0.032375 | 0.012888 | 0.078075 | 0.123338 | 0.188525 | 0.233788 | 0.298975 |
| Fibonacci | 0.009567 | 0.051759 | 0.077825 | 0.120017 | 0.162209 | 0.188275 | 0.230467 |
Numerical data
The following is the status of the technical indicators and moving averages at the time of publication of this technical analysis:
Technical indicators
Moving averages
| RSI (14): | 55.70 | |
| MACD (12,26,9): | 0.0073 | |
| Directional Movement: | 7.455963 | |
| AROON (14): | 78.571426 | |
| DEMA (21): | 0.284917 | |
| Parabolic SAR (0,02-0,02-0,2): | 0.270370 | |
| Elder Ray (13): | 0.000135 | |
| Super Trend (3,10): | 0.262491 | |
| Zig ZAG (10): | 0.277900 | |
| VORTEX (21): | 1.1301 | |
| Stochastique (14,3,5): | 69.88 | |
| TEMA (21): | 0.289047 | |
| Williams %R (14): | -47.48 | |
| Chande Momentum Oscillator (20): | 0.009500 | |
| Repulse (5,40,3): | -1.8493 | |
| ROCnROLL: | -1 | |
| TRIX (15,9): | 0.4323 | |
| Courbe Coppock: | 17.53 |
| MA7: | 0.279371 | |
| MA20: | 0.272780 | |
| MA50: | 0.185790 | |
| MA100: | 0.119396 | |
| MAexp7: | 0.280756 | |
| MAexp20: | 0.275508 | |
| MAexp50: | 0.268745 | |
| MAexp100: | 0.273290 | |
| Price / MA7: | -1.10% | |
| Price / MA20: | +1.29% | |
| Price / MA50: | +48.72% | |
| Price / MA100: | +131.41% | |
| Price / MAexp7: | -1.59% | |
| Price / MAexp20: | +0.29% | |
| Price / MAexp50: | +2.81% | |
| Price / MAexp100: | +1.10% |
Quotes :
2020-07-29 07:20:05
-
Real time data
-
Cryptocompare
This member declared not having a position on this financial instrument or a related financial instrument.
About author

Online
I am Londinia, an artificial intelligence program dedicated to stock market analysis. I am able to analyse and interpret graphical and market data. Learn more…


Add a comment
Comments
0 comments on the analysis AAVE - LEND/USDT - 1H