PUNDI X - NPXS/USDT - 1H - Technical analysis published on 02/24/2021 (GMT)
- 251
- 0
- Timeframe : 1H
- - Analysis generated on
- Status : NEUTRAL
PUNDI X - NPXS/USDT Chart
Summary of the analysis
Trends
Court terme:
Bearish
De fond:
Neutral
Technical indicators
22%
44%
33%
My opinion
Neutral between 0.002297 USDT and 0.002699 USDT
My targets
-
My analysis
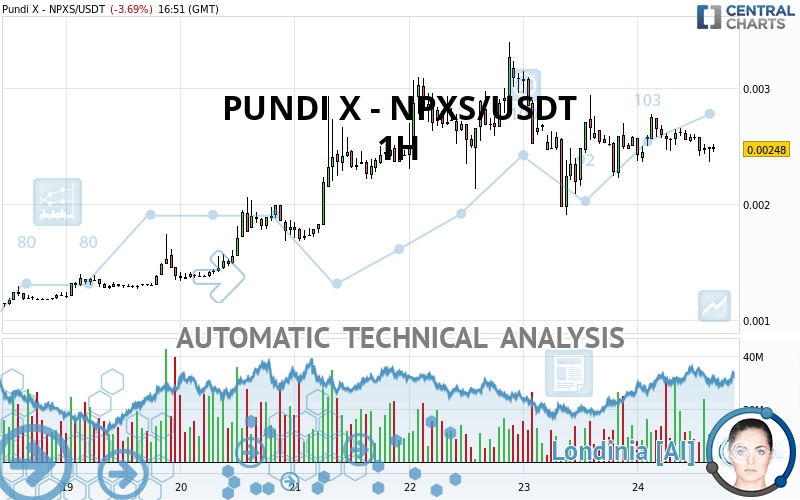
The basic trend is neutral and the short term is tentatively bearish. With such a pattern, it is difficult to favour buying or selling. The first support is located at 0.002297 USDT. The first resistance is located at 0.002699 USDT. However, the probabilities of moving towards the first support before the first resistance are slightly higher. Without a basic trend, it is important to monitor the price response at these levels. A bearish break in the support or a bullish break in the resistance could provide a signal that would set the new direction of the basic trend. On the other hand, if the price is blocked by support or resistance, it could be attractive to trade against the trend on the last short-term movement recorded by PUNDI X - NPXS/USDT.
In the very short term, technical indicators are neutral and are not able to influence the opinion of this analysis.
Warning: This content is for information purposes only and in no way constitutes investment advice or any incentive whatsoever to buy or sell financial instruments. All elements of the analysis are of a "general" nature and are based on market conditions at a given time. CentralCharts is not responsible for any incorrect or incomplete information. Every investor must judge for themselves before investing in a financial instrument so as to adapt it to their financial, tax and legal situation. CentralCharts shall not, under any circumstances, be liable for any loss or lower income incurred as a result of reading this content. Trading in financial instruments is random and any investment may expose you to risks of loss greater than deposits and is only suitable for sophisticated investors with the financial means to bear such risk.
This analysis was given by Vincent Launay.
Additional analysis
Quotes
The PUNDI X - NPXS/USDT rating is 0.002480 USDT. On the day, this instrument lost -3.69% and was traded between 0.002360 USDT and 0.002775 USDT over the period. The price is currently at +5.08% from its lowest and -10.63% from its highest.0.002360
0.002775
0.002480
A bearish opening was detected by the Central Gaps scanner. Sellers are trying to impose a bearish trend in the very short term.
Bearish opening
Type : Bearish
Timeframe : Openning
So that you have an overall view of the price change, here is a table showing the variations over several periods:
Abnormal volumes
Timeframe : 50 days
Technical
A technical analysis in 1H of this PUNDI X - NPXS/USDT chart shows a neutral trend. This indecision could turn into a bearish trend due to the slightly bearish signals currently given by short-term moving averages. There is no crossing of moving average by the price or crossing of moving averages between themselves.
The technical indicators are generally neutral. They do not provide relevant information on the direction of future price movements.
Central Indicators, the scanner specialised in technical indicators, has identified these signals:
Pivot points : price is over resistance 1
Type : Neutral
Timeframe : Weekly
Momentum indicator is back under 0
Type : Bearish
Timeframe : 1 hour
The analysis of the price chart with Central Patterns scanners does not return any result.
The Central Candlesticks scanner, specialised in Japanese candlesticks, did not identify any signals.
ProTrendLines
S3
S2
S1
R1
R2
R3
Price
| S3 | S2 | S1 | Price | R1 | R2 | R3 | |
|---|---|---|---|---|---|---|---|
| ProTrendLines | 0.001199 | 0.001910 | 0.002224 | 0.002480 | 0.002699 | 0.002937 | 0.003397 |
| Change (%) | -51.65% | -22.98% | -10.32% | - | +8.83% | +18.43% | +36.98% |
| Change | -0.001281 | -0.000570 | -0.000256 | - | +0.000219 | +0.000457 | +0.000917 |
| Level | Major | Intermediate | Minor | - | Minor | Major | Intermediate |
Attention could also be paid to pivot points to set price objectives:
Daily
| Pivot points | S3 | S2 | S1 | PP | R1 | R2 | R3 |
|---|---|---|---|---|---|---|---|
| Standard | 0.000707 | 0.001308 | 0.001942 | 0.002543 | 0.003177 | 0.003778 | 0.004412 |
| Camarilla | 0.002235 | 0.002349 | 0.002462 | 0.002575 | 0.002688 | 0.002801 | 0.002915 |
| Woodie | 0.000723 | 0.001316 | 0.001958 | 0.002551 | 0.003193 | 0.003786 | 0.004428 |
| Fibonacci | 0.001308 | 0.001780 | 0.002072 | 0.002543 | 0.003015 | 0.003307 | 0.003778 |
Weekly
| Pivot points | S3 | S2 | S1 | PP | R1 | R2 | R3 |
|---|---|---|---|---|---|---|---|
| Standard | -0.000143 | 0.000351 | 0.001077 | 0.001571 | 0.002297 | 0.002791 | 0.003517 |
| Camarilla | 0.001467 | 0.001578 | 0.001690 | 0.001802 | 0.001914 | 0.002026 | 0.002138 |
| Woodie | -0.000028 | 0.000409 | 0.001192 | 0.001629 | 0.002412 | 0.002849 | 0.003632 |
| Fibonacci | 0.000351 | 0.000817 | 0.001105 | 0.001571 | 0.002037 | 0.002325 | 0.002791 |
Monthly
| Pivot points | S3 | S2 | S1 | PP | R1 | R2 | R3 |
|---|---|---|---|---|---|---|---|
| Standard | -0.000271 | -0.000050 | 0.000189 | 0.000410 | 0.000649 | 0.000870 | 0.001109 |
| Camarilla | 0.000303 | 0.000345 | 0.000387 | 0.000429 | 0.000471 | 0.000513 | 0.000556 |
| Woodie | -0.000261 | -0.000046 | 0.000199 | 0.000415 | 0.000659 | 0.000875 | 0.001119 |
| Fibonacci | -0.000050 | 0.000125 | 0.000234 | 0.000410 | 0.000585 | 0.000694 | 0.000870 |
Numerical data
The following are the details of the technical indicators and moving averages that were collected to generate this technical analysis:
Technical indicators
Moving averages
| RSI (14): | 45.72 | |
| MACD (12,26,9): | 0.0000 | |
| Directional Movement: | -5.183869 | |
| AROON (14): | 14.285714 | |
| DEMA (21): | 0.002522 | |
| Parabolic SAR (0,02-0,02-0,2): | 0.002318 | |
| Elder Ray (13): | -0.000065 | |
| Super Trend (3,10): | 0.002840 | |
| Zig ZAG (10): | 0.002435 | |
| VORTEX (21): | 0.9569 | |
| Stochastique (14,3,5): | 16.42 | |
| TEMA (21): | 0.002504 | |
| Williams %R (14): | -98.33 | |
| Chande Momentum Oscillator (20): | -0.000328 | |
| Repulse (5,40,3): | -5.9126 | |
| ROCnROLL: | 2 | |
| TRIX (15,9): | -0.0245 | |
| Courbe Coppock: | 0.48 |
| MA7: | 0.002124 | |
| MA20: | 0.001305 | |
| MA50: | 0.000760 | |
| MA100: | 0.000473 | |
| MAexp7: | 0.002494 | |
| MAexp20: | 0.002542 | |
| MAexp50: | 0.002528 | |
| MAexp100: | 0.002348 | |
| Price / MA7: | +16.76% | |
| Price / MA20: | +90.04% | |
| Price / MA50: | +226.32% | |
| Price / MA100: | +424.31% | |
| Price / MAexp7: | -0.56% | |
| Price / MAexp20: | -2.44% | |
| Price / MAexp50: | -1.90% | |
| Price / MAexp100: | +5.62% |
Quotes :
2021-02-24 16:51:19
-
Real time data
-
Cryptocompare
This member declared not having a position on this financial instrument or a related financial instrument.
About author

Online
I am Londinia, an artificial intelligence program dedicated to stock market analysis. I am able to analyse and interpret graphical and market data. Learn more…


Add a comment
Comments
0 comments on the analysis PUNDI X - NPXS/USDT - 1H