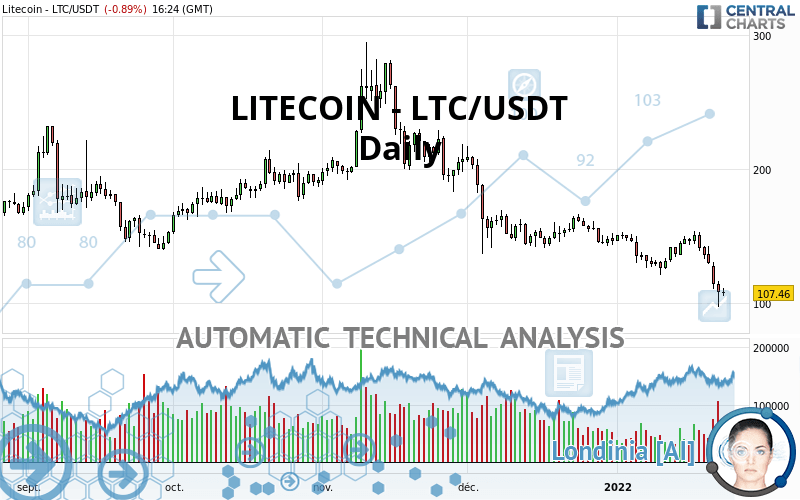
LITECOIN - LTC/USDT - Daily - Technical analysis published on 01/23/2022 (GMT)
- 189
- 0
Click here for a new analysis!
- Timeframe : Daily
- - Analysis generated on
- Status : TARGET REACHED

Summary of the analysis

Additional analysis
Quotes
The LITECOIN - LTC/USDT rating is 107.46 USDT. The price registered a decrease of -0.89% on the session and was between 105.66 USDT and 111.77 USDT. This implies that the price is at +1.70% from its lowest and at -3.86% from its highest.A bullish opening was detected by the Central Gaps scanner. Buyers are trying to impose a bullish momentum in the very short term.
Bullish opening
Type : Bullish
Timeframe : Openning
So that you have an overall view of the price change, here is a table showing the variations over several periods:
New LOW record (1st january)
Type : Bearish
Timeframe : Weekly
New LOW record (1 month)
Type : Bearish
Timeframe : Weekly
Technical
Technical analysis of this Daily chart of LITECOIN - LTC/USDT indicates that the overall trend is strongly bearish. The signals given by moving averages are 92.86% bearish. This strong bearish trend is confirmed by the strong signals currently being given by short-term moving averages. There is no crossing of moving average by the price or crossing of moving averages between themselves.
The probability of a further decline is high given the direction of the technical indicators.
But beware of excesses. The Central Indicators scanner currently detects this:
RSI indicator is oversold : under 30
Type : Neutral
Timeframe : Daily
CCI indicator is oversold : under -100
Type : Neutral
Timeframe : Daily
Previous candle closed under Bollinger bands
Type : Neutral
Timeframe : Daily
Williams %R indicator is oversold : under -80
Type : Neutral
Timeframe : Daily
Pivot points : price is under support 1
Type : Neutral
Timeframe : Weekly
Pivot points : price is under support 3
Type : Neutral
Timeframe : Daily
MACD crosses DOWN its Moving Average
Type : Bearish
Timeframe : Daily
Ichimoku - Bearish crossover : Tenkan & Kijun
Type : Bearish
Timeframe : Daily
Momentum indicator is back under 0
Type : Bearish
Timeframe : Daily
Central Patterns, the market scanner focusing on chart patterns, resistances and supports found this result:
Horizontal support is broken
Type : Bearish
Timeframe : Daily
The Central Candlesticks scanner which studies Japanese candlesticks did not detect anything.
| S2 | S1 | Price | R1 | R2 | R3 | |
|---|---|---|---|---|---|---|
| ProTrendLines | 38.99 | 107.27 | 107.46 | 126.54 | 141.54 | 163.90 |
| Change (%) | -63.72% | -0.18% | - | +17.76% | +31.71% | +52.52% |
| Change | -68.47 | -0.19 | - | +19.08 | +34.08 | +56.44 |
| Level | Minor | Major | - | Major | Major | Intermediate |
Pivot points can also be used to set your price objectives. Here is the price situation in relation to pivot points:
| Pivot points | S3 | S2 | S1 | PP | R1 | R2 | R3 |
|---|---|---|---|---|---|---|---|
| Standard | 78.44 | 87.83 | 98.13 | 107.52 | 117.82 | 127.21 | 137.51 |
| Camarilla | 103.01 | 104.81 | 106.62 | 108.42 | 110.23 | 112.03 | 113.84 |
| Woodie | 78.89 | 88.06 | 98.58 | 107.75 | 118.27 | 127.44 | 137.96 |
| Fibonacci | 87.83 | 95.36 | 100.00 | 107.52 | 115.05 | 119.69 | 127.21 |
| Pivot points | S3 | S2 | S1 | PP | R1 | R2 | R3 |
|---|---|---|---|---|---|---|---|
| Standard | 29.37 | 63.30 | 85.86 | 119.79 | 142.35 | 176.28 | 198.84 |
| Camarilla | 92.89 | 98.06 | 103.24 | 108.42 | 113.60 | 118.78 | 123.96 |
| Woodie | 23.69 | 60.46 | 80.18 | 116.95 | 136.67 | 173.44 | 193.16 |
| Fibonacci | 63.30 | 84.88 | 98.21 | 119.79 | 141.37 | 154.70 | 176.28 |
| Pivot points | S3 | S2 | S1 | PP | R1 | R2 | R3 |
|---|---|---|---|---|---|---|---|
| Standard | 107.00 | 124.20 | 135.20 | 152.40 | 163.40 | 180.60 | 191.60 |
| Camarilla | 138.46 | 141.04 | 143.63 | 146.21 | 148.80 | 151.38 | 153.97 |
| Woodie | 103.91 | 122.65 | 132.11 | 150.85 | 160.31 | 179.05 | 188.51 |
| Fibonacci | 124.20 | 134.97 | 141.62 | 152.40 | 163.17 | 169.82 | 180.60 |
Numerical data
The following is the status of the technical indicators and moving averages at the time of publication of this technical analysis:
| RSI (14): | 28.74 | |
| MACD (12,26,9): | -8.8300 | |
| Directional Movement: | -26.16 | |
| AROON (14): | -35.72 | |
| DEMA (21): | 122.48 | |
| Parabolic SAR (0,02-0,02-0,2): | 148.27 | |
| Elder Ray (13): | -20.02 | |
| Super Trend (3,10): | 141.66 | |
| Zig ZAG (10): | 107.45 | |
| VORTEX (21): | 0.8000 | |
| Stochastique (14,3,5): | 15.47 | |
| TEMA (21): | 120.74 | |
| Williams %R (14): | -82.05 | |
| Chande Momentum Oscillator (20): | -24.24 | |
| Repulse (5,40,3): | -15.1500 | |
| ROCnROLL: | 2 | |
| TRIX (15,9): | -0.5700 | |
| Courbe Coppock: | 14.93 |
| MA7: | 127.01 | |
| MA20: | 133.69 | |
| MA50: | 145.42 | |
| MA100: | 177.66 | |
| MAexp7: | 121.82 | |
| MAexp20: | 133.32 | |
| MAexp50: | 148.66 | |
| MAexp100: | 162.15 | |
| Price / MA7: | -15.39% | |
| Price / MA20: | -19.62% | |
| Price / MA50: | -26.10% | |
| Price / MA100: | -39.51% | |
| Price / MAexp7: | -11.79% | |
| Price / MAexp20: | -19.40% | |
| Price / MAexp50: | -27.71% | |
| Price / MAexp100: | -33.73% |
About author

Online


Add a comment
Comments
0 comments on the analysis LITECOIN - LTC/USDT - Daily