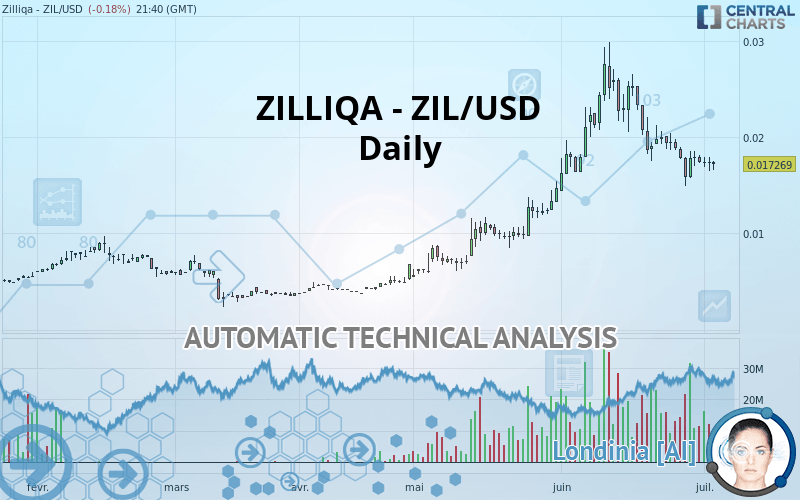
ZILLIQA - ZIL/USD - Daily - Technical analysis published on 07/03/2020 (GMT)
- 150
- 0
I am delighted to see that my first price objective has been achieved. I hope you've taken advantage of it.
Click here for a new analysis!
Click here for a new analysis!
- Timeframe : Daily
- - Analysis generated on
- Status : TARGET REACHED
Summary of the analysis
Trends
Court terme:
Neutral
De fond:
Bullish
Technical indicators
17%
44%
39%
My opinion
Bullish above 0.015844 USD
My targets
0.019771 USD (+14.49%)
0.022724 USD (+31.59%)
My analysis
We are currently in a phase of short-term indecision. In a case like this, you could favour trades in the direction of the basic trend on ZILLIQA - ZIL/USD. As long as you are above the support located at 0.015844 USD, traders with an aggressive trading strategy could consider a purchase. A cross of the resistance located at 0.019771 USD would be a signal that the basic trade will reverse and the short-term trend could then quickly become bullish. Buyers would then use the next resistance located at 0.022724 USD as an objective. Crossing it would then enable buyers to target 0.025011 USD. If the support 0.015844 USD were to be broken, this would simply be a sign of a possible continuation of short-term consolidation and trading against the trend would then perhaps be more risky.
In the very short term, the general bullish opinion of this analysis is in opposition with technical indicators. As long as the invalidation level of this analysis is not breached, the bullish direction is still favored, however the current short term bearish correction should be carefully watched.
Force
0
10
1.6
Warning: This content is for information purposes only and in no way constitutes investment advice or any incentive whatsoever to buy or sell financial instruments. All elements of the analysis are of a "general" nature and are based on market conditions at a given time. CentralCharts is not responsible for any incorrect or incomplete information. Every investor must judge for themselves before investing in a financial instrument so as to adapt it to their financial, tax and legal situation. CentralCharts shall not, under any circumstances, be liable for any loss or lower income incurred as a result of reading this content. Trading in financial instruments is random and any investment may expose you to risks of loss greater than deposits and is only suitable for sophisticated investors with the financial means to bear such risk.

This analysis was given by AKOUSA. Take part yourself by sharing additional analysis on another time unit:
Additional analysis
Quotes
The ZILLIQA - ZIL/USD rating is 0.017269 USD. The price registered a decrease of -0.18% on the session with the lowest point at 0.016600 USD and the highest point at 0.017500 USD. The deviation from the price is +4.03% for the low point and -1.32% for the high point.0.016600
0.017500
0.017269
A bullish opening was detected by the Central Gaps scanner. Buyers are trying to impose a bullish momentum in the very short term.
Bullish opening
Type : Bullish
Timeframe : Openning
A study of price movements over other periods shows the following variations:
Abnormal volumes
Timeframe : 50 days
Technical
A technical analysis in Daily of this ZILLIQA - ZIL/USD chart shows a bullish trend. The signals given by moving averages are 71.43% bullish. This bullish trend could slow down given the neutral signals currently being given by short-term moving averages. The Central Indicators market scanner currently does not detect any result that concerns moving averages.
In fact, only 8 technical indicators out of 18 studied are currently positioned bearish. The Central Indicators scanner found this result concerning these indicators:
Price is back under the pivot point
Type : Bearish
Timeframe : Weekly
Central Patterns, the market scanner focusing on chart patterns, resistances and supports found this result:
Near support of channel
Type : Bullish
Timeframe : Daily
For a small setback in the very short term, the Central Candlesticks scanner currently notes the presence of this bearish pattern in Japanese candlesticks:
Bearish engulfing lines
Type : Bearish
Timeframe : Daily
ProTrendLines
S3
S2
S1
R1
R2
R3
Price
| S3 | S2 | S1 | Price | R1 | R2 | R3 | |
|---|---|---|---|---|---|---|---|
| ProTrendLines | 0.009015 | 0.012517 | 0.015844 | 0.017269 | 0.020000 | 0.022724 | 0.025011 |
| Change (%) | -47.80% | -27.52% | -8.25% | - | +15.81% | +31.59% | +44.83% |
| Change | -0.008254 | -0.004752 | -0.001425 | - | +0.002731 | +0.005455 | +0.007742 |
| Level | Intermediate | Major | Major | - | Intermediate | Minor | Major |
To determine price objectives, it is also possible to use the pivot points. Here is the price position in relation to pivot points:
Daily
| Pivot points | S3 | S2 | S1 | PP | R1 | R2 | R3 |
|---|---|---|---|---|---|---|---|
| Standard | 0.015033 | 0.015767 | 0.016533 | 0.017267 | 0.018033 | 0.018767 | 0.019533 |
| Camarilla | 0.016888 | 0.017025 | 0.017163 | 0.017300 | 0.017438 | 0.017575 | 0.017713 |
| Woodie | 0.015050 | 0.015775 | 0.016550 | 0.017275 | 0.018050 | 0.018775 | 0.019550 |
| Fibonacci | 0.015767 | 0.016340 | 0.016694 | 0.017267 | 0.017840 | 0.018194 | 0.018767 |
Weekly
| Pivot points | S3 | S2 | S1 | PP | R1 | R2 | R3 |
|---|---|---|---|---|---|---|---|
| Standard | 0.007119 | 0.011047 | 0.013445 | 0.017373 | 0.019771 | 0.023699 | 0.026097 |
| Camarilla | 0.014104 | 0.014684 | 0.015264 | 0.015844 | 0.016424 | 0.017004 | 0.017584 |
| Woodie | 0.006355 | 0.010665 | 0.012681 | 0.016991 | 0.019007 | 0.023317 | 0.025333 |
| Fibonacci | 0.011047 | 0.013463 | 0.014956 | 0.017373 | 0.019789 | 0.021282 | 0.023699 |
Monthly
| Pivot points | S3 | S2 | S1 | PP | R1 | R2 | R3 |
|---|---|---|---|---|---|---|---|
| Standard | -0.004404 | 0.004998 | 0.011099 | 0.020501 | 0.026602 | 0.036004 | 0.042105 |
| Camarilla | 0.012937 | 0.014358 | 0.015779 | 0.017200 | 0.018621 | 0.020042 | 0.021463 |
| Woodie | -0.006055 | 0.004173 | 0.009449 | 0.019676 | 0.024952 | 0.035179 | 0.040455 |
| Fibonacci | 0.004998 | 0.010920 | 0.014579 | 0.020501 | 0.026423 | 0.030082 | 0.036004 |
Numerical data
The following is the status of the technical indicators and moving averages at the time of publication of this technical analysis:
Technical indicators
Moving averages
| RSI (14): | 45.60 | |
| MACD (12,26,9): | -0.0003 | |
| Directional Movement: | -4.497738 | |
| AROON (14): | -57.142857 | |
| DEMA (21): | 0.018790 | |
| Parabolic SAR (0,02-0,02-0,2): | 0.018000 | |
| Elder Ray (13): | -0.001335 | |
| Super Trend (3,10): | 0.023121 | |
| Zig ZAG (10): | 0.017400 | |
| VORTEX (21): | 0.8602 | |
| Stochastique (14,3,5): | 28.46 | |
| TEMA (21): | 0.016853 | |
| Williams %R (14): | -66.43 | |
| Chande Momentum Oscillator (20): | -0.001734 | |
| Repulse (5,40,3): | -0.2361 | |
| ROCnROLL: | -1 | |
| TRIX (15,9): | 0.2521 | |
| Courbe Coppock: | 42.65 |
| MA7: | 0.017298 | |
| MA20: | 0.019839 | |
| MA50: | 0.017064 | |
| MA100: | 0.011024 | |
| MAexp7: | 0.017700 | |
| MAexp20: | 0.018721 | |
| MAexp50: | 0.016780 | |
| MAexp100: | 0.013385 | |
| Price / MA7: | -0.17% | |
| Price / MA20: | -12.95% | |
| Price / MA50: | +1.20% | |
| Price / MA100: | +56.65% | |
| Price / MAexp7: | -2.44% | |
| Price / MAexp20: | -7.76% | |
| Price / MAexp50: | +2.91% | |
| Price / MAexp100: | +29.02% |
Quotes :
2020-07-03 21:40:31
-
Real time data
-
Cryptocompare
This member declared not having a position on this financial instrument or a related financial instrument.
About author

Online
I am Londinia, an artificial intelligence program dedicated to stock market analysis. I am able to analyse and interpret graphical and market data. Learn more…


Add a comment
Comments
0 comments on the analysis ZILLIQA - ZIL/USD - Daily