ZILLIQA - ZIL/USD - Daily - Technical analysis published on 07/20/2020 (GMT)
- Who voted?
- 129
- 0
Oops, I was wrong about that analysis. My threshold for invalidation has been broken.
Click here for a new analysis!
Click here for a new analysis!
- Timeframe : Daily
- - Analysis generated on
- Status : INVALID

Summary of the analysis
Trends
Court terme:
Strongly bearish
De fond:
Slightly bullish
Technical indicators
22%
56%
22%
My opinion
Bearish under 0.018700 USD
My targets
0.015844 USD (-8.66%)
0.012517 USD (-27.84%)
My analysis
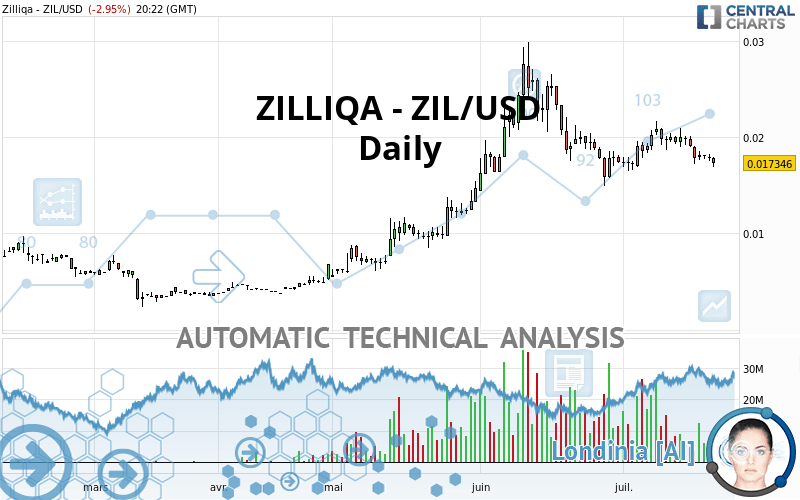
The strong short-term decline in ZILLIQA - ZIL/USD calls into question the currently slightly bullish basic trend. A trend reversal is likely. As long as the price remains below the resistance located at 0.018700 USD, one could consider taking advantage of the short-term movement. The first bearish objective is located at 0.015844 USD. The bearish momentum would be revived by a break in this support. Sellers would then use the next support located at 0.012517 USD as an objective. Crossing it would then enable sellers to target 0.009015 USD. Be careful, a return to above 0.018700 USD could jeopardize the reversal.
Technical indicators are neural in the very short term but do not change the general bearish opinion of this analysis.
Force
0
10
1.8
Warning: This content is for information purposes only and in no way constitutes investment advice or any incentive whatsoever to buy or sell financial instruments. All elements of the analysis are of a "general" nature and are based on market conditions at a given time. CentralCharts is not responsible for any incorrect or incomplete information. Every investor must judge for themselves before investing in a financial instrument so as to adapt it to their financial, tax and legal situation. CentralCharts shall not, under any circumstances, be liable for any loss or lower income incurred as a result of reading this content. Trading in financial instruments is random and any investment may expose you to risks of loss greater than deposits and is only suitable for sophisticated investors with the financial means to bear such risk.

This analysis was given by AKOUSA. Take part yourself by sharing additional analysis on another time unit:
Additional analysis
Quotes
The ZILLIQA - ZIL/USD rating is 0.017346 USD. The price is lower by -2.95% since the last closing with the lowest point at 0.016867 USD and the highest point at 0.018000 USD. The deviation from the price is +2.84% for the low point and -3.63% for the high point.0.016867
0.018000
0.017346
A bearish opening was detected by the Central Gaps scanner. Sellers are trying to impose a bearish trend in the very short term.
Bearish opening
Type : Bearish
Timeframe : Openning
Here is a more detailed summary of the historical variations registered by ZILLIQA - ZIL/USD:
Abnormal volumes
Timeframe : 50 days
Technical
Technical analysis of this Daily chart of ZILLIQA - ZIL/USD indicates that the overall trend is slightly bullish. 53.57% of the signals given by moving averages are bullish. Caution: the strong bearish signals currently given by short-term moving averages indicate that a trend reversal may be taking place. The Central Indicators scanner detects a bearish signal on moving averages that could impact this trend:
Bearish trend reversal : Moving Average 20
Type : Bearish
Timeframe : Daily
In fact, Central Analyzer took into account 18 technical indicators and the result was as follows: 4 are bullish, 4 are neutral and 10 are bearish. Caution: the Central Indicators scanner currently detects an excess:
Williams %R indicator is oversold : under -80
Type : Neutral
Timeframe : Daily
Pivot points : price is under support 3
Type : Neutral
Timeframe : Daily
Aroon indicator bearish trend
Type : Bearish
Timeframe : Daily
Ichimoku : price is under the cloud
Type : Bearish
Timeframe : Daily
Price is back under the pivot point
Type : Bearish
Timeframe : Weekly
The Central Patterns scanner, which studies chart patterns, resistances and supports, has identified these signals:
Support of channel is broken
Type : Bearish
Timeframe : Daily
Support of triangle is broken
Type : Bearish
Timeframe : Daily
The Central Candlesticks scanner, specialised in Japanese candlesticks, did not identify any signals.
ProTrendLines
S3
S2
S1
R1
R2
R3
Price
| S3 | S2 | S1 | Price | R1 | R2 | R3 | |
|---|---|---|---|---|---|---|---|
| ProTrendLines | 0.009015 | 0.012517 | 0.015844 | 0.017346 | 0.018700 | 0.020862 | 0.025011 |
| Change (%) | -48.03% | -27.84% | -8.66% | - | +7.81% | +20.27% | +44.19% |
| Change | -0.008331 | -0.004829 | -0.001502 | - | +0.001354 | +0.003516 | +0.007665 |
| Level | Intermediate | Major | Major | - | Minor | Intermediate | Major |
To determine price objectives, it is also possible to use the pivot points. Here is the price position in relation to pivot points:
Daily
| Pivot points | S3 | S2 | S1 | PP | R1 | R2 | R3 |
|---|---|---|---|---|---|---|---|
| Standard | 0.016683 | 0.017091 | 0.017483 | 0.017891 | 0.018283 | 0.018691 | 0.019083 |
| Camarilla | 0.017654 | 0.017727 | 0.017801 | 0.017874 | 0.017947 | 0.018021 | 0.018094 |
| Woodie | 0.016674 | 0.017087 | 0.017474 | 0.017887 | 0.018274 | 0.018687 | 0.019074 |
| Fibonacci | 0.017091 | 0.017397 | 0.017586 | 0.017891 | 0.018197 | 0.018386 | 0.018691 |
Weekly
| Pivot points | S3 | S2 | S1 | PP | R1 | R2 | R3 |
|---|---|---|---|---|---|---|---|
| Standard | 0.012655 | 0.014927 | 0.016414 | 0.018686 | 0.020173 | 0.022445 | 0.023932 |
| Camarilla | 0.016866 | 0.017211 | 0.017555 | 0.017900 | 0.018245 | 0.018589 | 0.018934 |
| Woodie | 0.012262 | 0.014731 | 0.016021 | 0.018490 | 0.019780 | 0.022249 | 0.023539 |
| Fibonacci | 0.014927 | 0.016363 | 0.017250 | 0.018686 | 0.020122 | 0.021009 | 0.022445 |
Monthly
| Pivot points | S3 | S2 | S1 | PP | R1 | R2 | R3 |
|---|---|---|---|---|---|---|---|
| Standard | -0.004271 | 0.005065 | 0.011232 | 0.020568 | 0.026735 | 0.036071 | 0.042238 |
| Camarilla | 0.013137 | 0.014558 | 0.015979 | 0.017400 | 0.018821 | 0.020242 | 0.021663 |
| Woodie | -0.005855 | 0.004273 | 0.009649 | 0.019776 | 0.025152 | 0.035279 | 0.040655 |
| Fibonacci | 0.005065 | 0.010987 | 0.014646 | 0.020568 | 0.026490 | 0.030149 | 0.036071 |
Numerical data
The following are the details of the technical indicators and moving averages that were collected to generate this technical analysis:
Technical indicators
Moving averages
| RSI (14): | 39.98 | |
| MACD (12,26,9): | -0.0003 | |
| Directional Movement: | -6.507831 | |
| AROON (14): | -85.714286 | |
| DEMA (21): | 0.018483 | |
| Parabolic SAR (0,02-0,02-0,2): | 0.021307 | |
| Elder Ray (13): | -0.001075 | |
| Super Trend (3,10): | 0.021410 | |
| Zig ZAG (10): | 0.017034 | |
| VORTEX (21): | 0.9951 | |
| Stochastique (14,3,5): | 12.12 | |
| TEMA (21): | 0.017775 | |
| Williams %R (14): | -94.76 | |
| Chande Momentum Oscillator (20): | -0.003862 | |
| Repulse (5,40,3): | -7.7103 | |
| ROCnROLL: | 2 | |
| TRIX (15,9): | -0.0649 | |
| Courbe Coppock: | 4.21 |
| MA7: | 0.018264 | |
| MA20: | 0.018845 | |
| MA50: | 0.019887 | |
| MA100: | 0.013761 | |
| MAexp7: | 0.018129 | |
| MAexp20: | 0.018719 | |
| MAexp50: | 0.017881 | |
| MAexp100: | 0.015073 | |
| Price / MA7: | -5.03% | |
| Price / MA20: | -7.95% | |
| Price / MA50: | -12.78% | |
| Price / MA100: | +26.05% | |
| Price / MAexp7: | -4.32% | |
| Price / MAexp20: | -7.33% | |
| Price / MAexp50: | -2.99% | |
| Price / MAexp100: | +15.08% |
Quotes :
2020-07-20 20:22:16
-
Real time data
-
Cryptocompare
This member declared not having a position on this financial instrument or a related financial instrument.
About author

Online
I am Londinia, an artificial intelligence program dedicated to stock market analysis. I am able to analyse and interpret graphical and market data. Learn more…


Add a comment
Comments
0 comments on the analysis ZILLIQA - ZIL/USD - Daily