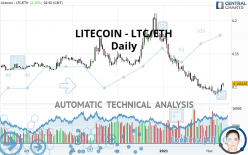
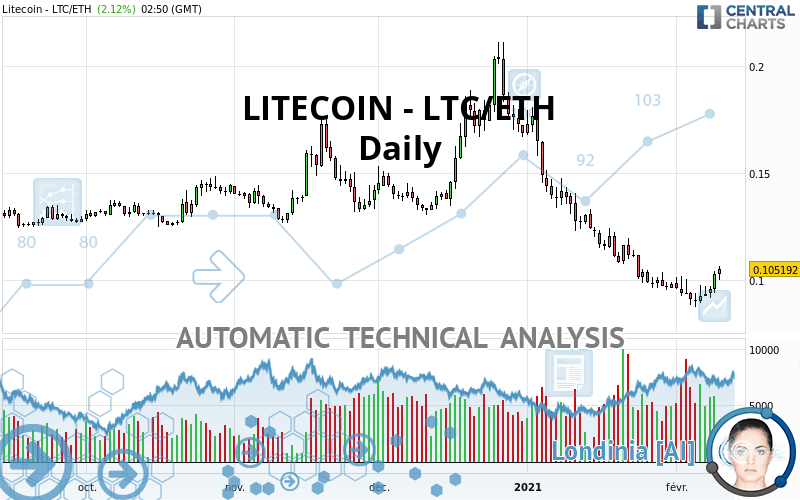
LITECOIN - LTC/ETH - Daily - Technical analysis published on 02/10/2021 (GMT)
- 164
- 0
Click here for a new analysis!
- Timeframe : Daily
- - Analysis generated on
- Status : LEVEL MAINTAINED
Summary of the analysis

Additional analysis
Quotes
The LITECOIN - LTC/ETH price is 0.105192 ETH. The price registered an increase of +2.12% on the session with the lowest point at 0.099900 ETH and the highest point at 0.106806 ETH. The deviation from the price is +5.30% for the low point and -1.51% for the high point.The Central Gaps scanner detects a bearish opening marking the presence of sellers ahead of buyers at the opening but not sufficiently marked to allow the price to register a quotation gap.
Bearish opening
Type : Bearish
Timeframe : Openning
Here is a more detailed summary of the historical variations registered by LITECOIN - LTC/ETH:
Technical
A technical analysis in Daily of this LITECOIN - LTC/ETH chart shows a bearish trend. 78.57% of the signals given by moving averages are bearish. Caution: the neutral signals currently given by short-term moving averages show us that the global trend is losing momentum. The Central Indicators market scanner is currently detecting several bullish signals that could impact this trend:
Bullish trend reversal : adaptative moving average 20
Type : Bullish
Timeframe : Daily
Bullish price crossover with Moving Average 20
Type : Bullish
Timeframe : Daily
Bullish price crossover with adaptative moving average 20
Type : Bullish
Timeframe : Daily
In fact, 11 technical indicators on 18 studied are currently bullish. Caution: the Central Indicators scanner currently detects an excess:
Williams %R indicator is overbought : over -20
Type : Neutral
Timeframe : Daily
Pivot points : price is over resistance 1
Type : Neutral
Timeframe : Weekly
Parabolic SAR indicator bullish reversal
Type : Bullish
Timeframe : Daily
Price is back over the pivot point
Type : Bullish
Timeframe : Daily
Price is back under the pivot point
Type : Bearish
Timeframe : Weekly
Momentum indicator is back over 0
Type : Bullish
Timeframe : Daily
Williams %R indicator is back over -50
Type : Bullish
Timeframe : Daily
No signals are given by Central Patterns, a market scanner specialised in chart patterns, resistances and supports.
The Central Candlesticks scanner, specialised in Japanese candlesticks, did not identify any signals.
| Price | R1 | R2 | R3 | |
|---|---|---|---|---|
| ProTrendLines | 0.105192 | 0.132852 | 0.155665 | 0.173011 |
| Change (%) | - | +26.29% | +47.98% | +64.47% |
| Change | - | +0.027660 | +0.050473 | +0.067819 |
| Level | - | Intermediate | Minor | Minor |
Pivot points can also be used to set your price objectives. Here is the price situation in relation to pivot points:
| Pivot points | S3 | S2 | S1 | PP | R1 | R2 | R3 |
|---|---|---|---|---|---|---|---|
| Standard | 0.086574 | 0.090372 | 0.096690 | 0.100488 | 0.106806 | 0.110604 | 0.116922 |
| Camarilla | 0.100225 | 0.101152 | 0.102080 | 0.103007 | 0.103934 | 0.104862 | 0.105789 |
| Woodie | 0.087833 | 0.091002 | 0.097949 | 0.101118 | 0.108065 | 0.111234 | 0.118181 |
| Fibonacci | 0.090372 | 0.094237 | 0.096624 | 0.100488 | 0.104353 | 0.106740 | 0.110604 |
| Pivot points | S3 | S2 | S1 | PP | R1 | R2 | R3 |
|---|---|---|---|---|---|---|---|
| Standard | 0.071796 | 0.079623 | 0.086174 | 0.094001 | 0.100552 | 0.108379 | 0.114930 |
| Camarilla | 0.088771 | 0.090089 | 0.091407 | 0.092725 | 0.094043 | 0.095361 | 0.096679 |
| Woodie | 0.071158 | 0.079304 | 0.085536 | 0.093682 | 0.099914 | 0.108060 | 0.114292 |
| Fibonacci | 0.079623 | 0.085115 | 0.088509 | 0.094001 | 0.099493 | 0.102887 | 0.108379 |
| Pivot points | S3 | S2 | S1 | PP | R1 | R2 | R3 |
|---|---|---|---|---|---|---|---|
| Standard | -0.023378 | 0.036089 | 0.067257 | 0.126724 | 0.157892 | 0.217359 | 0.248527 |
| Camarilla | 0.073500 | 0.081809 | 0.090117 | 0.098425 | 0.106733 | 0.115041 | 0.123350 |
| Woodie | -0.037528 | 0.029014 | 0.053108 | 0.119649 | 0.143743 | 0.210284 | 0.234378 |
| Fibonacci | 0.036089 | 0.070712 | 0.092101 | 0.126724 | 0.161347 | 0.182736 | 0.217359 |
Numerical data
The following is the status of technical indicators and moving averages registered at the time this technical analysis was created:
| RSI (14): | 44.34 | |
| MACD (12,26,9): | -0.0075 | |
| Directional Movement: | -2.912537 | |
| AROON (14): | 28.571427 | |
| DEMA (21): | 0.090176 | |
| Parabolic SAR (0,02-0,02-0,2): | 0.087787 | |
| Elder Ray (13): | 0.003390 | |
| Super Trend (3,10): | 0.111578 | |
| Zig ZAG (10): | 0.101569 | |
| VORTEX (21): | 0.9401 | |
| Stochastique (14,3,5): | 74.70 | |
| TEMA (21): | 0.092562 | |
| Williams %R (14): | -13.16 | |
| Chande Momentum Oscillator (20): | 0.004525 | |
| Repulse (5,40,3): | 6.3561 | |
| ROCnROLL: | -1 | |
| TRIX (15,9): | -1.2988 | |
| Courbe Coppock: | 11.00 |
| MA7: | 0.095757 | |
| MA20: | 0.098517 | |
| MA50: | 0.128831 | |
| MA100: | 0.137128 | |
| MAexp7: | 0.098382 | |
| MAexp20: | 0.101727 | |
| MAexp50: | 0.117818 | |
| MAexp100: | 0.129688 | |
| Price / MA7: | +9.85% | |
| Price / MA20: | +6.78% | |
| Price / MA50: | -18.35% | |
| Price / MA100: | -23.29% | |
| Price / MAexp7: | +6.92% | |
| Price / MAexp20: | +3.41% | |
| Price / MAexp50: | -10.72% | |
| Price / MAexp100: | -18.89% |
About author

Online


Add a comment
Comments
0 comments on the analysis LITECOIN - LTC/ETH - Daily