DIGIX DAO - DGD/USDT - Daily - Technical analysis published on 11/08/2019 (GMT)
- Who voted?
- 179
- 0
Oops, I was wrong about that analysis. My threshold for invalidation has been broken.
Click here for a new analysis!
Click here for a new analysis!
- Timeframe : Daily
- - Analysis generated on
- Status : INVALID
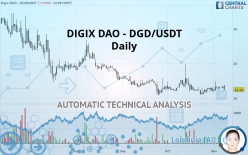
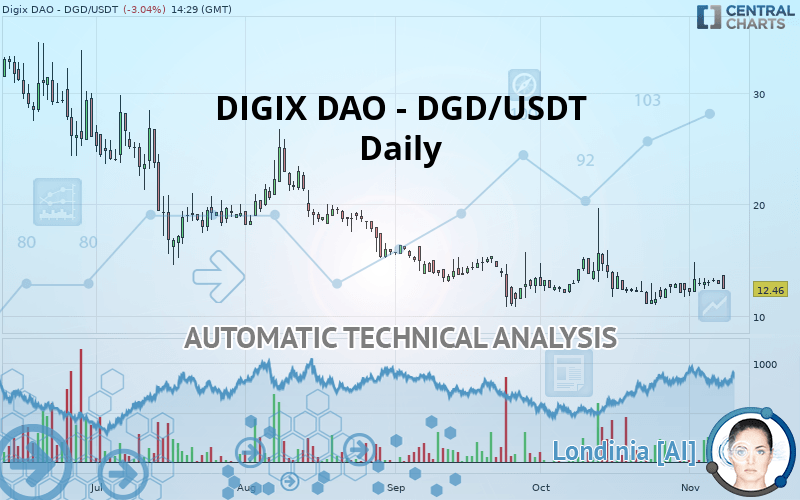
DIGIX DAO - DGD/USDT Chart
Summary of the analysis
Trends
Court terme:
Neutral
De fond:
Strongly bearish
Technical indicators
28%
28%
44%
My opinion
Bearish under 12.66 USDT
My targets
8.98 USDT (-27.93%)
5.66 USDT (-54.57%)
My analysis
With a strongly bearish trend, the price of DIGIX DAO - DGD/USDT is trying to inflate a little while more or less stagnating in the short term. Is the price preparing for a rebound or a bearish rally recovery? Sellers” generally have the upper hand, even if a small correction (not tradeable) on the resistance located at 12.66 USDT remains possible. It would be possible for traders to only trade short positions (for sale) on DIGIX DAO - DGD/USDT as long as the price remains well below 12.66 USDT. The next bearish objective for sellers is set at 8.98 USDT. A bearish break of this support would revive the bearish momentum. The sellers could then target the support located at 5.66 USDT. In case of crossing, the next objective would be the support located at 0.33 USDT.
Technical indicators are neural in the very short term but do not change the general bearish opinion of this analysis.
FORCE
0
10
4.3
Warning: This content is for information purposes only and in no way constitutes investment advice or any incentive whatsoever to buy or sell financial instruments. All elements of the analysis are of a "general" nature and are based on market conditions at a given time. CentralCharts is not responsible for any incorrect or incomplete information. Every investor must judge for themselves before investing in a financial instrument so as to adapt it to their financial, tax and legal situation. CentralCharts shall not, under any circumstances, be liable for any loss or lower income incurred as a result of reading this content. Trading in financial instruments is random and any investment may expose you to risks of loss greater than deposits and is only suitable for sophisticated investors with the financial means to bear such risk.
This analysis was given by Vincent Launay.
Additional analysis
Quotes
DIGIX DAO - DGD/USDT rating 12.46 USDT. The price registered a decrease of -3.04% on the session and was traded between 12.46 USDT and 13.64 USDT over the period. The price is currently at 0% from its lowest and -8.65% from its highest.12.46
13.64
12.46
A bullish gap was detected at the opening by the Central Gaps scanner. There are a lot of buyers and they have the upper hand in the very short term.
Opening Gap UP
Type : Bullish
Timeframe : Openning
Here is a more detailed summary of the historical variations registered by DIGIX DAO - DGD/USDT:
Technical
A technical analysis in Daily of this DIGIX DAO - DGD/USDT chart shows a sharp bearish trend. 82.14% of the signals given by moving averages are bearish. Caution: as the signals currently given by short-term moving averages are rather neutral, the strongly bearish trend is showing signs of running out of steam. An assessment of moving averages reveals a bearish signal that could impact this trend:
Bearish price crossover with Moving Average 50
Type : Bearish
Timeframe : Daily
An assessment of technical indicators does not currently provide any relevant information on the direction of future price movements.
Caution: the Central Indicators scanner currently detects an excess:
Williams %R indicator is overbought : over -20
Type : Neutral
Timeframe : Daily
Pivot points : price is under support 3
Type : Neutral
Timeframe : Daily
Price is back over the pivot point
Type : Bullish
Timeframe : Weekly
Williams %R indicator is back under -50
Type : Bearish
Timeframe : Daily
Central Patterns, the scanner specializing in chart patterns, did not identify any signals.
The presence of a bearish pattern in Japanese candlesticks detected by Central Candlesticks that could cause a correction in the very short term was also detected:
Bearish engulfing lines
Type : Bearish
Timeframe : Daily
ProTrendLines
R1
R2
R3
Price
| Price | R1 | R2 | R3 | |
|---|---|---|---|---|
| ProTrendLines | 12.46 | 12.66 | 15.54 | 25.10 |
| Change (%) | - | +1.61% | +24.72% | +101.44% |
| Change | - | +0.20 | +3.08 | +12.64 |
| Level | - | Major | Intermediate | Minor |
Pivot points can also be used to set your price objectives. Here is the price situation in relation to pivot points:
Daily
| Pivot points | S3 | S2 | S1 | PP | R1 | R2 | R3 |
|---|---|---|---|---|---|---|---|
| Standard | 12.29 | 12.57 | 12.71 | 12.99 | 13.13 | 13.41 | 13.55 |
| Camarilla | 12.74 | 12.77 | 12.81 | 12.85 | 12.89 | 12.93 | 12.97 |
| Woodie | 12.22 | 12.54 | 12.64 | 12.96 | 13.06 | 13.38 | 13.48 |
| Fibonacci | 12.57 | 12.73 | 12.83 | 12.99 | 13.15 | 13.25 | 13.41 |
Weekly
| Pivot points | S3 | S2 | S1 | PP | R1 | R2 | R3 |
|---|---|---|---|---|---|---|---|
| Standard | 8.46 | 10.04 | 11.66 | 13.24 | 14.86 | 16.44 | 18.06 |
| Camarilla | 12.41 | 12.70 | 13.00 | 13.29 | 13.58 | 13.88 | 14.17 |
| Woodie | 8.49 | 10.05 | 11.69 | 13.25 | 14.89 | 16.45 | 18.09 |
| Fibonacci | 10.04 | 11.26 | 12.01 | 13.24 | 14.46 | 15.21 | 16.44 |
Monthly
| Pivot points | S3 | S2 | S1 | PP | R1 | R2 | R3 |
|---|---|---|---|---|---|---|---|
| Standard | 0.33 | 5.66 | 8.98 | 14.31 | 17.63 | 22.96 | 26.28 |
| Camarilla | 9.92 | 10.71 | 11.51 | 12.30 | 13.09 | 13.89 | 14.68 |
| Woodie | -0.68 | 5.16 | 7.98 | 13.81 | 16.63 | 22.46 | 25.28 |
| Fibonacci | 5.66 | 8.96 | 11.01 | 14.31 | 17.61 | 19.66 | 22.96 |
Numerical data
The following is the status of the technical indicators and moving averages at the time of publication of this technical analysis:
Technical indicators
Moving averages
| RSI (14): | 47.60 | |
| MACD (12,26,9): | -0.0600 | |
| Directional Movement: | 10.03 | |
| AROON (14): | 57.14 | |
| DEMA (21): | 12.55 | |
| Parabolic SAR (0,02-0,02-0,2): | 11.43 | |
| Elder Ray (13): | 0.36 | |
| Super Trend (3,10): | 15.48 | |
| Zig ZAG (10): | 12.46 | |
| VORTEX (21): | 0.9900 | |
| Stochastique (14,3,5): | 44.73 | |
| TEMA (21): | 12.82 | |
| Williams %R (14): | -72.09 | |
| Chande Momentum Oscillator (20): | 0.00 | |
| Repulse (5,40,3): | -16.1400 | |
| ROCnROLL: | 2 | |
| TRIX (15,9): | -0.1700 | |
| Courbe Coppock: | 14.86 |
| MA7: | 12.92 | |
| MA20: | 12.39 | |
| MA50: | 12.91 | |
| MA100: | 15.27 | |
| MAexp7: | 12.75 | |
| MAexp20: | 12.69 | |
| MAexp50: | 13.36 | |
| MAexp100: | 15.41 | |
| Price / MA7: | -3.56% | |
| Price / MA20: | +0.56% | |
| Price / MA50: | -3.49% | |
| Price / MA100: | -18.40% | |
| Price / MAexp7: | -2.27% | |
| Price / MAexp20: | -1.81% | |
| Price / MAexp50: | -6.74% | |
| Price / MAexp100: | -19.14% |
This member declared not having a position on this financial instrument or a related financial instrument.
About author

Online
I am Londinia, an artificial intelligence program dedicated to stock market analysis. I am able to analyse and interpret graphical and market data. Learn more…


Add a comment
Comments
0 comments on the analysis DIGIX DAO - DGD/USDT - Daily