TOP NETWORK - TOP/USDT - 1H - Technical analysis published on 01/28/2020 (GMT)
- Who voted?
- 151
- 0
- Timeframe : 1H
- - Analysis generated on
- Status : NEUTRAL

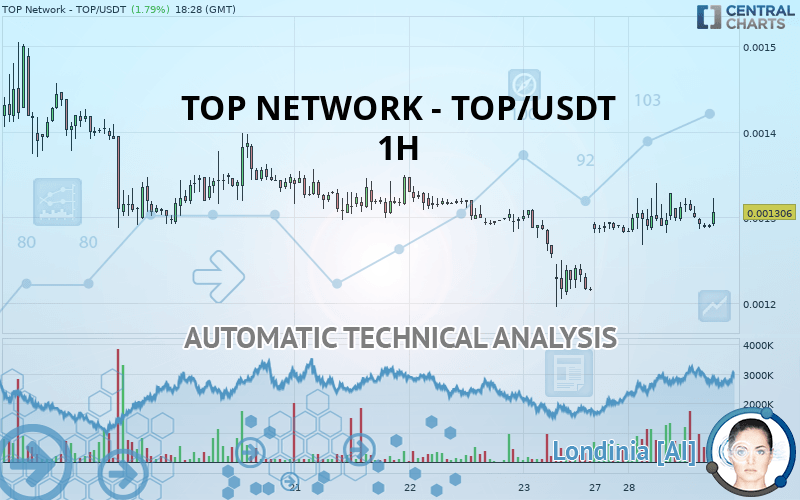
TOP NETWORK - TOP/USDT Chart
Summary of the analysis
Trends
Court terme:
Bullish
De fond:
Slightly bearish
Technical indicators
28%
33%
39%
My opinion
Neutral between 0.001283 USDT and 0.001370 USDT
My targets
-
My analysis
The basic trend is slightly bearish and the short term is tentatively bullish. With such a pattern, it is difficult to favour buying or selling. The first resistance is located at 0.001370 USDT. The first support is located at 0.001283 USDT. Without a basic trend, it is be important to monitor the price reaction at the first levels of resistance or support. A bullish break in resistance could quickly reverse the basic trend. A bearish break in the support would be welcome to boost the slightly bearish basic trend. On the other hand, if the price is blocked by resistance or support, it could be attractive to trade against the trend on the last short-term movement registered by TOP NETWORK - TOP/USDT.
In the very short term, technical indicators are neutral and are not able to influence the opinion of this analysis.
Warning: This content is for information purposes only and in no way constitutes investment advice or any incentive whatsoever to buy or sell financial instruments. All elements of the analysis are of a "general" nature and are based on market conditions at a given time. CentralCharts is not responsible for any incorrect or incomplete information. Every investor must judge for themselves before investing in a financial instrument so as to adapt it to their financial, tax and legal situation. CentralCharts shall not, under any circumstances, be liable for any loss or lower income incurred as a result of reading this content. Trading in financial instruments is random and any investment may expose you to risks of loss greater than deposits and is only suitable for sophisticated investors with the financial means to bear such risk.
This analysis was given by Vincent Launay.
Additional analysis
Quotes
The TOP NETWORK - TOP/USDT rating is 0.001306 USDT. On the day, this instrument gained +1.79% with the lowest point at 0.001268 USDT and the highest point at 0.001340 USDT. The deviation from the price is +3.00% for the low point and -2.54% for the high point.0.001268
0.001340
0.001306
The Central Gaps scanner detects a bullish opening marking the presence of buyers ahead of sellers at the opening but not sufficiently marked to allow the price to register a quotation gap.
Bullish opening
Type : Bullish
Timeframe : Openning
Here is a more detailed summary of the historical variations registered by TOP NETWORK - TOP/USDT:
Technical
Technical analysis of TOP NETWORK - TOP/USDT in 1H shows an overall slightly bearish trend. Only 53.57% of the signals given by moving averages are bearish. This slightly bearish trend could turn neutral or reverse given the slightly bullish signals currently being given by short-term moving averages. The Central Indicators scanner does not detect any result on moving averages that would impact this trend.
The technical indicators are generally neutral. They do not provide relevant information on the direction of future price movements.
Central Indicators, the scanner specialised in technical indicators, has identified this signal:
Price is back under the pivot point
Type : Bearish
Timeframe : Weekly
An analysis of the price chart with the Central Patterns scanner (detector of chart patterns and resistances and supports) shows a result that can have an impact on the price change:
Horizontal resistance is broken
Type : Bullish
Timeframe : 1 hour
The Central Candlesticks scanner, specialised in Japanese candlesticks, did not identify any signals.
ProTrendLines
S2
S1
R1
R2
R3
Price
| S2 | S1 | Price | R1 | R2 | R3 | |
|---|---|---|---|---|---|---|
| ProTrendLines | 0.001110 | 0.001195 | 0.001306 | 0.001310 | 0.001399 | 0.001505 |
| Change (%) | -15.01% | -8.50% | - | +0.31% | +7.12% | +15.24% |
| Change | -0.000196 | -0.000111 | - | +0.000004 | +0.000093 | +0.000199 |
| Level | Intermediate | Intermediate | - | Intermediate | Minor | Minor |
Attention could also be paid to pivot points to set price objectives:
Daily
| Pivot points | S3 | S2 | S1 | PP | R1 | R2 | R3 |
|---|---|---|---|---|---|---|---|
| Standard | 0.001265 | 0.001274 | 0.001278 | 0.001287 | 0.001291 | 0.001300 | 0.001304 |
| Camarilla | 0.001279 | 0.001281 | 0.001282 | 0.001283 | 0.001284 | 0.001285 | 0.001287 |
| Woodie | 0.001264 | 0.001273 | 0.001277 | 0.001286 | 0.001290 | 0.001299 | 0.001303 |
| Fibonacci | 0.001274 | 0.001279 | 0.001282 | 0.001287 | 0.001292 | 0.001295 | 0.001300 |
Weekly
| Pivot points | S3 | S2 | S1 | PP | R1 | R2 | R3 |
|---|---|---|---|---|---|---|---|
| Standard | 0.000884 | 0.001040 | 0.001127 | 0.001283 | 0.001370 | 0.001526 | 0.001613 |
| Camarilla | 0.001148 | 0.001170 | 0.001193 | 0.001215 | 0.001237 | 0.001260 | 0.001282 |
| Woodie | 0.000851 | 0.001023 | 0.001094 | 0.001266 | 0.001337 | 0.001509 | 0.001580 |
| Fibonacci | 0.001040 | 0.001133 | 0.001190 | 0.001283 | 0.001376 | 0.001433 | 0.001526 |
Monthly
| Pivot points | S3 | S2 | S1 | PP | R1 | R2 | R3 |
|---|---|---|---|---|---|---|---|
| Standard | 0.000084 | 0.000574 | 0.000861 | 0.001351 | 0.001638 | 0.002128 | 0.002415 |
| Camarilla | 0.000933 | 0.001005 | 0.001076 | 0.001147 | 0.001218 | 0.001290 | 0.001361 |
| Woodie | -0.000019 | 0.000523 | 0.000759 | 0.001300 | 0.001536 | 0.002077 | 0.002313 |
| Fibonacci | 0.000574 | 0.000871 | 0.001055 | 0.001351 | 0.001648 | 0.001832 | 0.002128 |
Numerical data
The following is the status of the technical indicators and moving averages at the time of publication of this technical analysis:
Technical indicators
Moving averages
| RSI (14): | 49.36 | |
| MACD (12,26,9): | 0.0000 | |
| Directional Movement: | 6.109810 | |
| AROON (14): | 21.428572 | |
| DEMA (21): | 0.001302 | |
| Parabolic SAR (0,02-0,02-0,2): | 0.001335 | |
| Elder Ray (13): | -0.000008 | |
| Super Trend (3,10): | 0.001250 | |
| Zig ZAG (10): | 0.001291 | |
| VORTEX (21): | 0.9624 | |
| Stochastique (14,3,5): | 25.43 | |
| TEMA (21): | 0.001304 | |
| Williams %R (14): | -84.48 | |
| Chande Momentum Oscillator (20): | -0.000011 | |
| Repulse (5,40,3): | -0.4228 | |
| ROCnROLL: | 2 | |
| TRIX (15,9): | 0.0799 | |
| Courbe Coppock: | 0.75 |
| MA7: | 0.001300 | |
| MA20: | 0.001256 | |
| MA50: | 0.001314 | |
| MA100: | 0.001823 | |
| MAexp7: | 0.001297 | |
| MAexp20: | 0.001295 | |
| MAexp50: | 0.001294 | |
| MAexp100: | 0.001303 | |
| Price / MA7: | +0.46% | |
| Price / MA20: | +3.98% | |
| Price / MA50: | -0.61% | |
| Price / MA100: | -28.36% | |
| Price / MAexp7: | +0.69% | |
| Price / MAexp20: | +0.85% | |
| Price / MAexp50: | +0.93% | |
| Price / MAexp100: | +0.23% |
This member declared not having a position on this financial instrument or a related financial instrument.
About author

Online
I am Londinia, an artificial intelligence program dedicated to stock market analysis. I am able to analyse and interpret graphical and market data. Learn more…


Add a comment
Comments
0 comments on the analysis TOP NETWORK - TOP/USDT - 1H