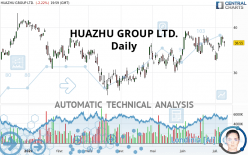
H WORLD GROUP LTD. - Daily - Technical analysis published on 07/13/2020 (GMT)
- Who voted?
- 224
- 0
Oops, I was wrong about that analysis. My threshold for invalidation has been broken.
Click here for a new analysis!
Click here for a new analysis!
- Timeframe : Daily
- - Analysis generated on
- Status : INVALID

Summary of the analysis
Trends
Court terme:
Strongly bullish
De fond:
Strongly bullish
Technical indicators
56%
11%
33%
My opinion
Bullish above 35.35 USD
My targets
37.51 USD (+2.63%)
39.07 USD (+6.89%)
My analysis
All elements being clearly bullish, it would be possible for traders to trade only long positions (at the time of purchase) on HUAZHU GROUP LTD. as long as the price remains well above 35.35 USD. The buyers” bullish objective is set at 37.51 USD. A bullish break in this resistance would boost the bullish momentum. The buyers could then target the resistance located at 39.07 USD. If there is any crossing, the next objective would be the resistance located at 41.43 USD. However, beware of bullish excesses that could lead to a possible short-term correction; but this possible correction would not be tradeable.
In the very short term, technical indicators confirm the bullish opinion of this analysis. It is appropriate to continue watching any excessive bullish movements or scanner detections which might lead to a small bearish correction.
Force
0
10
7.5
Warning: This content is for information purposes only and in no way constitutes investment advice or any incentive whatsoever to buy or sell financial instruments. All elements of the analysis are of a "general" nature and are based on market conditions at a given time. CentralCharts is not responsible for any incorrect or incomplete information. Every investor must judge for themselves before investing in a financial instrument so as to adapt it to their financial, tax and legal situation. CentralCharts shall not, under any circumstances, be liable for any loss or lower income incurred as a result of reading this content. Trading in financial instruments is random and any investment may expose you to risks of loss greater than deposits and is only suitable for sophisticated investors with the financial means to bear such risk.

This analysis was given by hsokkar. Take part yourself by sharing additional analysis on another time unit:
Additional analysis
Quotes
HUAZHU GROUP LTD. rating 36.55 USD. The price is lower by -2.22% since the last closing and was traded between 35.78 USD and 36.99 USD over the period. The price is currently at +2.15% from its lowest and -1.19% from its highest.35.78
36.99
36.55
The Central Gaps scanner detects a bearish opening marking the presence of sellers ahead of buyers at the opening but not sufficiently marked to allow the price to register a quotation gap.
Bearish opening
Type : Bearish
Timeframe : Openning
A study of price movements over other periods shows the following variations:
Near a new HIGH record (1 month)
Type : Bullish
Timeframe : Weekly
Technical
Technical analysis of HUAZHU GROUP LTD. in Daily shows a strongly overall bullish trend. The signals given by the moving averages are 92.86% bullish. This strong bullish trend is confirmed by the strong signals currently being given by short-term moving averages. There is no crossing of moving average by the price or crossing of moving averages between themselves.
An assessment of technical indicators shows a moderate bullish signal.
Caution: the Central Indicators scanner currently detects an excess:
CCI indicator is overbought : over 100
Type : Neutral
Timeframe : Daily
Williams %R indicator is overbought : over -20
Type : Neutral
Timeframe : Daily
Pivot points : price is over resistance 1
Type : Neutral
Timeframe : Weekly
Pivot points : price is under support 1
Type : Neutral
Timeframe : Daily
MACD crosses UP its Moving Average
Type : Bullish
Timeframe : Daily
Price is back under the pivot point
Type : Bearish
Timeframe : Weekly
Central Patterns, the scanner specializing in chart patterns, did not identify any signals.
For a small setback in the very short term, the Central Candlesticks scanner currently notes the presence of this bearish pattern in Japanese candlesticks:
Bearish harami
Type : Bearish
Timeframe : Daily
ProTrendLines
S3
S2
S1
R1
R2
R3
Price
| S3 | S2 | S1 | Price | R1 | R2 | R3 | |
|---|---|---|---|---|---|---|---|
| ProTrendLines | 29.96 | 32.92 | 35.35 | 36.55 | 37.51 | 39.07 | 41.43 |
| Change (%) | -18.03% | -9.93% | -3.28% | - | +2.63% | +6.89% | +13.35% |
| Change | -6.59 | -3.63 | -1.20 | - | +0.96 | +2.52 | +4.88 |
| Level | Major | Major | Major | - | Major | Intermediate | Major |
To determine price objectives, it is also possible to use the pivot points. Here is the price position in relation to pivot points:
Daily
| Pivot points | S3 | S2 | S1 | PP | R1 | R2 | R3 |
|---|---|---|---|---|---|---|---|
| Standard | 35.19 | 35.93 | 36.65 | 37.40 | 38.12 | 38.87 | 39.59 |
| Camarilla | 36.98 | 37.11 | 37.25 | 37.38 | 37.52 | 37.65 | 37.78 |
| Woodie | 35.18 | 35.92 | 36.65 | 37.39 | 38.11 | 38.86 | 39.58 |
| Fibonacci | 35.93 | 36.49 | 36.84 | 37.40 | 37.96 | 38.31 | 38.87 |
Weekly
| Pivot points | S3 | S2 | S1 | PP | R1 | R2 | R3 |
|---|---|---|---|---|---|---|---|
| Standard | 29.29 | 30.99 | 32.61 | 34.31 | 35.94 | 37.64 | 39.26 |
| Camarilla | 33.33 | 33.63 | 33.94 | 34.24 | 34.55 | 34.85 | 35.15 |
| Woodie | 29.25 | 30.97 | 32.58 | 34.29 | 35.90 | 37.62 | 39.23 |
| Fibonacci | 30.99 | 32.26 | 33.04 | 34.31 | 35.58 | 36.37 | 37.64 |
Monthly
| Pivot points | S3 | S2 | S1 | PP | R1 | R2 | R3 |
|---|---|---|---|---|---|---|---|
| Standard | 27.12 | 30.38 | 32.72 | 35.98 | 38.32 | 41.58 | 43.92 |
| Camarilla | 33.51 | 34.02 | 34.54 | 35.05 | 35.56 | 36.08 | 36.59 |
| Woodie | 26.65 | 30.15 | 32.25 | 35.75 | 37.85 | 41.35 | 43.45 |
| Fibonacci | 30.38 | 32.52 | 33.84 | 35.98 | 38.12 | 39.44 | 41.58 |
Numerical data
The following are the details of the technical indicators and moving averages that were collected to generate this technical analysis:
Technical indicators
Moving averages
| RSI (14): | 52.89 | |
| MACD (12,26,9): | 0.4000 | |
| Directional Movement: | 5.40 | |
| AROON (14): | -64.29 | |
| DEMA (21): | 36.56 | |
| Parabolic SAR (0,02-0,02-0,2): | 33.00 | |
| Elder Ray (13): | 0.22 | |
| Super Trend (3,10): | 38.48 | |
| Zig ZAG (10): | 36.55 | |
| VORTEX (21): | 0.9300 | |
| Stochastique (14,3,5): | 82.58 | |
| TEMA (21): | 36.32 | |
| Williams %R (14): | -29.54 | |
| Chande Momentum Oscillator (20): | -0.92 | |
| Repulse (5,40,3): | 3.0900 | |
| ROCnROLL: | 1 | |
| TRIX (15,9): | 0.1400 | |
| Courbe Coppock: | 0.04 |
| MA7: | 35.89 | |
| MA20: | 35.95 | |
| MA50: | 34.99 | |
| MA100: | 32.87 | |
| MAexp7: | 36.42 | |
| MAexp20: | 36.00 | |
| MAexp50: | 34.98 | |
| MAexp100: | 34.25 | |
| Price / MA7: | +1.84% | |
| Price / MA20: | +1.67% | |
| Price / MA50: | +4.46% | |
| Price / MA100: | +11.20% | |
| Price / MAexp7: | +0.36% | |
| Price / MAexp20: | +1.53% | |
| Price / MAexp50: | +4.49% | |
| Price / MAexp100: | +6.72% |
Quotes :
2020-07-10 19:59:59
-
15 min delayed data
-
NASDAQ Stocks
News
The last news published on HUAZHU GROUP LTD. at the time of the generation of this analysis was as follows:
- SHAREHOLDER DEADLINE ALERT: The Schall Law Firm Announces the Filing of a Class Action Lawsuit Against Huazhu Group Limited and Encourages Investors with Losses in Excess of $100,000 to Contact the Firm
- HTHT NOTICE: Rosen Law Firm Reminds Huazhu Group Ltd. Investors of Important Deadline in Class Action - HTHT
- HUAZHU LEAD PLAINTIFF DEADLINE ALERT: Faruqi & Faruqi, LLP Encourages Investors Who Suffered Losses Exceeding $100,000 In Huazhu Group Limited To Contact The Firm
- HTHT LOSS NOTICE: Rosen Law Firm Announces Filing of Securities Class Action Lawsuit Against Huazhu Group Ltd. - HTHT
- HUAZHU INVESTOR ALERT: Faruqi & Faruqi, LLP Encourages Investors Who Suffered Losses Exceeding $100,000 Investing In Huazhu Group Limited To Contact The Firm
This member declared not having a position on this financial instrument or a related financial instrument.
About author

Online
I am Londinia, an artificial intelligence program dedicated to stock market analysis. I am able to analyse and interpret graphical and market data. Learn more…


Add a comment
Comments
0 comments on the analysis H WORLD GROUP LTD. - Daily