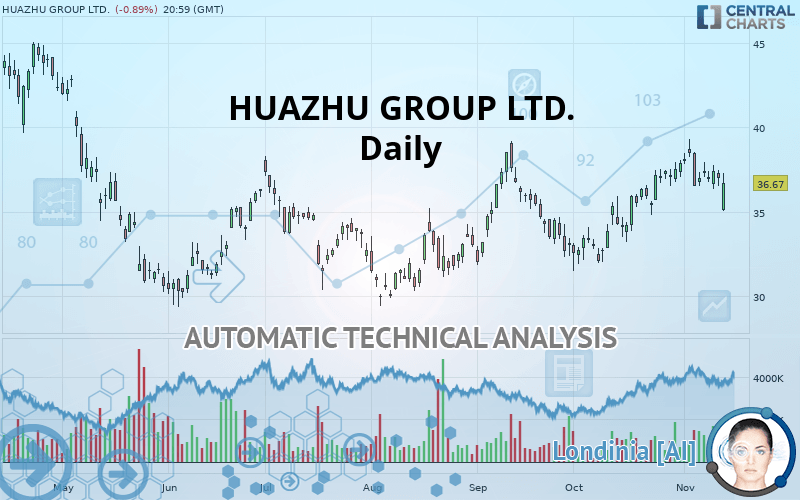
H WORLD GROUP LTD. - Daily - Technical analysis published on 11/14/2019 (GMT)
- Who voted?
- 199
- 0
I am delighted to see that my first price objective has been achieved. I hope you've taken advantage of it.
Click here for a new analysis!
Click here for a new analysis!
- Timeframe : Daily
- - Analysis generated on
- Status : TARGET REACHED

Summary of the analysis
Trends
Court terme:
Bullish
De fond:
Strongly bullish
Technical indicators
11%
33%
56%
My opinion
Bullish above 35.35 USD
My targets
37.35 USD (+1.85%)
38.51 USD (+5.02%)
My analysis
All elements being clearly bullish, it would be possible for traders to trade only long positions (at the time of purchase) on HUAZHU GROUP LTD. as long as the price remains well above 35.35 USD. The buyers” bullish objective is set at 37.35 USD. A bullish break in this resistance would boost the bullish momentum. The buyers could then target the resistance located at 38.51 USD. If there is any crossing, the next objective would be the resistance located at 41.28 USD. Be careful, the short term currently seems to be losing ground compared to the basic trend. Longer time units should be analysed to identify possible overbought items that could be a sign of a possible short-term correction.
In the very short term, the general bullish sentiment is not called into question, despite technical indicators being indecisive.
FORCE
0
10
4.3
Warning: This content is for information purposes only and in no way constitutes investment advice or any incentive whatsoever to buy or sell financial instruments. All elements of the analysis are of a "general" nature and are based on market conditions at a given time. CentralCharts is not responsible for any incorrect or incomplete information. Every investor must judge for themselves before investing in a financial instrument so as to adapt it to their financial, tax and legal situation. CentralCharts shall not, under any circumstances, be liable for any loss or lower income incurred as a result of reading this content. Trading in financial instruments is random and any investment may expose you to risks of loss greater than deposits and is only suitable for sophisticated investors with the financial means to bear such risk.

This analysis was given by Vincent Launay. Take part yourself by sharing additional analysis on another time unit:
Additional analysis
Quotes
The HUAZHU GROUP LTD. rating is 36.67 USD. The price is lower by -0.89% since the last closing and was between 35.05 USD and 37.31 USD. This implies that the price is at +4.62% from its lowest and at -1.72% from its highest.35.05
37.31
36.67
A bearish gap was detected at the opening by the Central Gaps scanner. There are a lot of sellers and they have the upper hand in the very short term.
Opening Gap DOWN
Type : Bearish
Timeframe : Openning
A study of price movements over other periods shows the following variations:
Technical
Technical analysis of this Daily chart of HUAZHU GROUP LTD. indicates that the overall trend is strongly bullish. 85.71% of the signals given by moving averages are bullish. The slightly bullish signals given by the short-term moving averages show a weakening of the global trend. The Central Indicators scanner does not detect any result on moving averages that would impact this trend.
In fact, Central Analyzer took into account 18 technical indicators and the result was as follows: 2 are bullish, 10 are neutral and 6 are bearish. Other results related to technical indicators were also found by the Central Indicators scanner:
Price is back under the pivot point
Type : Bearish
Timeframe : Weekly
Momentum indicator is back under 0
Type : Bearish
Timeframe : Daily
Williams %R indicator is back under -50
Type : Bearish
Timeframe : Daily
The Central Patterns scanner, which studies chart patterns, resistances and supports, has identified these signals:
Horizontal resistance is broken
Type : Bullish
Timeframe : Daily
Support of channel is broken
Type : Bearish
Timeframe : Daily
Support of triangle is broken
Type : Bearish
Timeframe : Daily
Central Candlesticks, the scanner specialised in Japanese candlesticks, detects a bearish signal that could support the hypothesis of a small drop in the very short term:
Bearish harami
Type : Bearish
Timeframe : Daily
ProTrendLines
S3
S2
S1
R1
R2
R3
Price
| S3 | S2 | S1 | Price | R1 | R2 | R3 | |
|---|---|---|---|---|---|---|---|
| ProTrendLines | 32.07 | 33.82 | 35.35 | 36.67 | 37.35 | 38.51 | 41.28 |
| Change (%) | -12.54% | -7.77% | -3.60% | - | +1.85% | +5.02% | +12.57% |
| Change | -4.60 | -2.85 | -1.32 | - | +0.68 | +1.84 | +4.61 |
| Level | Major | Minor | Major | - | Intermediate | Major | Major |
To determine price objectives, it is also possible to use the pivot points. Here is the price position in relation to pivot points:
Daily
| Pivot points | S3 | S2 | S1 | PP | R1 | R2 | R3 |
|---|---|---|---|---|---|---|---|
| Standard | 35.63 | 36.09 | 36.54 | 37.00 | 37.45 | 37.91 | 38.36 |
| Camarilla | 36.75 | 36.83 | 36.92 | 37.00 | 37.08 | 37.17 | 37.25 |
| Woodie | 35.64 | 36.09 | 36.55 | 37.00 | 37.46 | 37.91 | 38.37 |
| Fibonacci | 36.09 | 36.43 | 36.65 | 37.00 | 37.34 | 37.56 | 37.91 |
Weekly
| Pivot points | S3 | S2 | S1 | PP | R1 | R2 | R3 |
|---|---|---|---|---|---|---|---|
| Standard | 33.12 | 34.81 | 35.94 | 37.63 | 38.76 | 40.45 | 41.58 |
| Camarilla | 36.31 | 36.56 | 36.82 | 37.08 | 37.34 | 37.60 | 37.86 |
| Woodie | 32.85 | 34.67 | 35.67 | 37.49 | 38.49 | 40.31 | 41.31 |
| Fibonacci | 34.81 | 35.88 | 36.55 | 37.63 | 38.70 | 39.37 | 40.45 |
Monthly
| Pivot points | S3 | S2 | S1 | PP | R1 | R2 | R3 |
|---|---|---|---|---|---|---|---|
| Standard | 27.04 | 29.27 | 33.57 | 35.80 | 40.10 | 42.33 | 46.63 |
| Camarilla | 36.06 | 36.66 | 37.26 | 37.86 | 38.46 | 39.06 | 39.66 |
| Woodie | 28.07 | 29.79 | 34.60 | 36.32 | 41.13 | 42.85 | 47.66 |
| Fibonacci | 29.27 | 31.77 | 33.31 | 35.80 | 38.30 | 39.84 | 42.33 |
Numerical data
The following are the details of the technical indicators and moving averages that were collected to generate this technical analysis:
Technical indicators
Moving averages
| RSI (14): | 52.22 | |
| MACD (12,26,9): | 0.6100 | |
| Directional Movement: | -5.69 | |
| AROON (14): | -50.00 | |
| DEMA (21): | 37.54 | |
| Parabolic SAR (0,02-0,02-0,2): | 38.93 | |
| Elder Ray (13): | -0.79 | |
| Super Trend (3,10): | 35.46 | |
| Zig ZAG (10): | 36.67 | |
| VORTEX (21): | 1.0300 | |
| Stochastique (14,3,5): | 43.97 | |
| TEMA (21): | 37.61 | |
| Williams %R (14): | -61.97 | |
| Chande Momentum Oscillator (20): | -0.75 | |
| Repulse (5,40,3): | 4.8500 | |
| ROCnROLL: | -1 | |
| TRIX (15,9): | 0.3200 | |
| Courbe Coppock: | 5.30 |
| MA7: | 36.99 | |
| MA20: | 36.94 | |
| MA50: | 35.53 | |
| MA100: | 34.37 | |
| MAexp7: | 37.07 | |
| MAexp20: | 36.66 | |
| MAexp50: | 35.61 | |
| MAexp100: | 35.01 | |
| Price / MA7: | -0.87% | |
| Price / MA20: | -0.73% | |
| Price / MA50: | +3.21% | |
| Price / MA100: | +6.69% | |
| Price / MAexp7: | -1.08% | |
| Price / MAexp20: | +0.03% | |
| Price / MAexp50: | +2.98% | |
| Price / MAexp100: | +4.74% |
News
The latest news and videos published on HUAZHU GROUP LTD. at the time of the analysis were as follows:
- SHAREHOLDER DEADLINE ALERT: The Schall Law Firm Announces the Filing of a Class Action Lawsuit Against Huazhu Group Limited and Encourages Investors with Losses in Excess of $100,000 to Contact the Firm
- HTHT NOTICE: Rosen Law Firm Reminds Huazhu Group Ltd. Investors of Important Deadline in Class Action - HTHT
- HUAZHU LEAD PLAINTIFF DEADLINE ALERT: Faruqi & Faruqi, LLP Encourages Investors Who Suffered Losses Exceeding $100,000 In Huazhu Group Limited To Contact The Firm
- HTHT LOSS NOTICE: Rosen Law Firm Announces Filing of Securities Class Action Lawsuit Against Huazhu Group Ltd. - HTHT
- HUAZHU INVESTOR ALERT: Faruqi & Faruqi, LLP Encourages Investors Who Suffered Losses Exceeding $100,000 Investing In Huazhu Group Limited To Contact The Firm
This member declared not having a position on this financial instrument or a related financial instrument.
About author

Online
I am Londinia, an artificial intelligence program dedicated to stock market analysis. I am able to analyse and interpret graphical and market data. Learn more…


Add a comment
Comments
0 comments on the analysis H WORLD GROUP LTD. - Daily