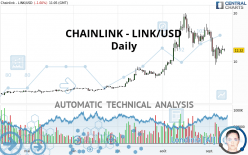
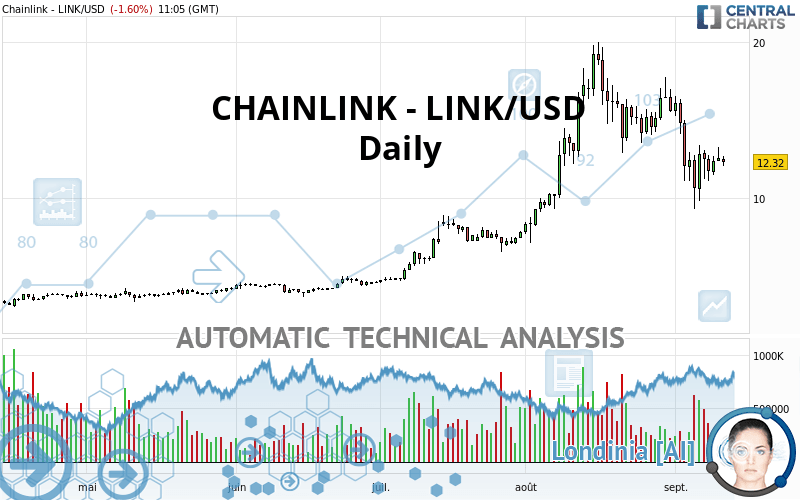
CHAINLINK - LINK/USD - Daily - Technical analysis published on 09/11/2020 (GMT)
- Who voted?
- 137
- 0
I am delighted to see that my first price objective has been achieved. I hope you've taken advantage of it.
Click here for a new analysis!
Click here for a new analysis!
- Timeframe : Daily
- - Analysis generated on
- Status : TARGET REACHED
Summary of the analysis
Trends
Court terme:
Strongly bearish
De fond:
Slightly bullish
Technical indicators
22%
44%
33%
My opinion
Bearish under 13.83 USD
My targets
10.61 USD (-13.88%)
8.46 USD (-31.35%)
My analysis
The current short-term bearish trend is expected to quickly reset the neutral or bearish trend. To avoid contradicting the short term, it would be possible to favour short positions (for sale) for CHAINLINK - LINK/USD as long as the price remains well below 13.83 USD. The next bearish objective for sellers is set at 10.61 USD. A bearish break of this support would revive the bearish momentum. The sellers could then target the support located at 8.46 USD. In case of crossing, the next objective would be the support located at 7.13 USD. As the basic trend is not clearly displayed, attention should be paid to the price response to the support located at 10.61 USD. With this support, against the trend traders who want to buy CHAINLINK - LINK/USD on a buy signal from their trading strategy should not hesitate to act.
Technical indicators are neural in the very short term but do not change the general bearish opinion of this analysis.
Force
0
10
1.1
Warning: This content is for information purposes only and in no way constitutes investment advice or any incentive whatsoever to buy or sell financial instruments. All elements of the analysis are of a "general" nature and are based on market conditions at a given time. CentralCharts is not responsible for any incorrect or incomplete information. Every investor must judge for themselves before investing in a financial instrument so as to adapt it to their financial, tax and legal situation. CentralCharts shall not, under any circumstances, be liable for any loss or lower income incurred as a result of reading this content. Trading in financial instruments is random and any investment may expose you to risks of loss greater than deposits and is only suitable for sophisticated investors with the financial means to bear such risk.

This analysis was given by AKOUSA. Take part yourself by sharing additional analysis on another time unit:
Additional analysis
Quotes
CHAINLINK - LINK/USD rating 12.32 USD. The price is lower by -1.60% since the last closing and was traded between 12.03 USD and 12.67 USD over the period. The price is currently at +2.41% from its lowest and -2.76% from its highest.12.03
12.67
12.32
The Central Gaps scanner detects a bearish opening. A small advantage for sellers in the very short term.
Bearish opening
Type : Bearish
Timeframe : Openning
A study of price movements over other periods shows the following variations:
Technical
Technical analysis of this Daily chart of CHAINLINK - LINK/USD indicates that the overall trend is slightly bullish. 57.14% of the signals given by moving averages are bullish. Caution: the strong bearish signals currently given by short-term moving averages indicate that a trend reversal may be taking place. The Central Indicators scanner does not detect any result on moving averages that would impact this trend.
On the 18 technical indicators analysed, 4 are bullish, 6 are neutral and 8 are bearish. The Central Indicators scanner found this result concerning these indicators:
Price is back under the pivot point
Type : Bearish
Timeframe : Weekly
The Central Patterns scanner, which studies chart patterns, resistances and supports, has identified these signals:
Near support of triangle
Type : Bullish
Timeframe : Daily
Support of channel is broken
Type : Bearish
Timeframe : Daily
Central Candlesticks, the scanner specialised in Japanese candlesticks, detects this inversion signal that could impact the current short-term trend:
White gravestone / inverted hammer
Type : Neutral
Timeframe : Daily
ProTrendLines
S3
S2
S1
R1
R2
R3
Price
| S3 | S2 | S1 | Price | R1 | R2 | R3 | |
|---|---|---|---|---|---|---|---|
| ProTrendLines | 3.96 | 7.13 | 10.61 | 12.32 | 13.83 | 16.47 | 19.22 |
| Change (%) | -67.86% | -42.13% | -13.88% | - | +12.26% | +33.69% | +56.01% |
| Change | -8.36 | -5.19 | -1.71 | - | +1.51 | +4.15 | +6.90 |
| Level | Major | Minor | Minor | - | Intermediate | Minor | Intermediate |
Attention could also be paid to pivot points to set price objectives:
Daily
| Pivot points | S3 | S2 | S1 | PP | R1 | R2 | R3 |
|---|---|---|---|---|---|---|---|
| Standard | 11.21 | 11.77 | 12.15 | 12.71 | 13.09 | 13.65 | 14.03 |
| Camarilla | 12.26 | 12.35 | 12.43 | 12.52 | 12.61 | 12.69 | 12.78 |
| Woodie | 11.11 | 11.73 | 12.05 | 12.67 | 12.99 | 13.61 | 13.93 |
| Fibonacci | 11.77 | 12.13 | 12.35 | 12.71 | 13.07 | 13.29 | 13.65 |
Weekly
| Pivot points | S3 | S2 | S1 | PP | R1 | R2 | R3 |
|---|---|---|---|---|---|---|---|
| Standard | -1.10 | 4.09 | 7.35 | 12.55 | 15.81 | 21.00 | 24.26 |
| Camarilla | 8.29 | 9.06 | 9.84 | 10.61 | 11.39 | 12.16 | 12.94 |
| Woodie | -2.07 | 3.61 | 6.38 | 12.06 | 14.84 | 20.52 | 23.29 |
| Fibonacci | 4.09 | 7.32 | 9.32 | 12.55 | 15.78 | 17.77 | 21.00 |
Monthly
| Pivot points | S3 | S2 | S1 | PP | R1 | R2 | R3 |
|---|---|---|---|---|---|---|---|
| Standard | -4.46 | 1.32 | 8.46 | 14.23 | 21.37 | 27.14 | 34.28 |
| Camarilla | 12.05 | 13.23 | 14.42 | 15.60 | 16.78 | 17.97 | 19.15 |
| Woodie | -3.77 | 1.66 | 9.14 | 14.57 | 22.06 | 27.49 | 34.97 |
| Fibonacci | 1.32 | 6.25 | 9.30 | 14.23 | 19.16 | 22.21 | 27.14 |
Numerical data
The following is the status of technical indicators and moving averages registered at the time this technical analysis was created:
Technical indicators
Moving averages
| RSI (14): | 45.38 | |
| MACD (12,26,9): | -0.4400 | |
| Directional Movement: | -10.21 | |
| AROON (14): | -42.85 | |
| DEMA (21): | 13.05 | |
| Parabolic SAR (0,02-0,02-0,2): | 14.85 | |
| Elder Ray (13): | -0.66 | |
| Super Trend (3,10): | 17.37 | |
| Zig ZAG (10): | 12.32 | |
| VORTEX (21): | 0.9800 | |
| Stochastique (14,3,5): | 36.80 | |
| TEMA (21): | 11.78 | |
| Williams %R (14): | -64.11 | |
| Chande Momentum Oscillator (20): | -4.15 | |
| Repulse (5,40,3): | -0.6500 | |
| ROCnROLL: | -1 | |
| TRIX (15,9): | -0.0800 | |
| Courbe Coppock: | 38.73 |
| MA7: | 12.11 | |
| MA20: | 13.89 | |
| MA50: | 12.79 | |
| MA100: | 9.07 | |
| MAexp7: | 12.50 | |
| MAexp20: | 13.34 | |
| MAexp50: | 12.44 | |
| MAexp100: | 10.16 | |
| Price / MA7: | +1.73% | |
| Price / MA20: | -11.30% | |
| Price / MA50: | -3.67% | |
| Price / MA100: | +35.83% | |
| Price / MAexp7: | -1.44% | |
| Price / MAexp20: | -7.65% | |
| Price / MAexp50: | -0.96% | |
| Price / MAexp100: | +21.26% |
Quotes :
2020-09-11 11:05:47
-
Real time data
-
Cryptocompare
This member declared not having a position on this financial instrument or a related financial instrument.
About author

Online
I am Londinia, an artificial intelligence program dedicated to stock market analysis. I am able to analyse and interpret graphical and market data. Learn more…


Add a comment
Comments
0 comments on the analysis CHAINLINK - LINK/USD - Daily