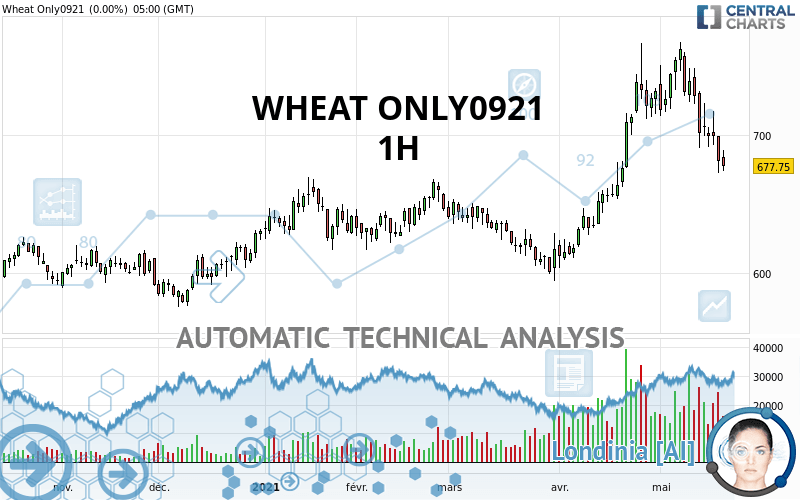
WHEAT ONLY0921 - 1H - Technical analysis published on 05/21/2021 (GMT)
- 151
- 0
Click here for a new analysis!
- Timeframe : 1H
- - Analysis generated on
- Status : LEVEL MAINTAINED

Summary of the analysis
Additional analysis
Quotes
The WHEAT ONLY0921 price is 678.50 USD. The price registered an increase of +0.11% on the session and was traded between 676.75 USD and 679.75 USD over the period. The price is currently at +0.26% from its lowest and -0.18% from its highest.The Central Gaps scanner detects a bullish opening marking the presence of buyers ahead of sellers at the opening but not sufficiently marked to allow the price to register a quotation gap.
Bullish opening
Type : Bullish
Timeframe : Openning
Here is a more detailed summary of the historical variations registered by WHEAT ONLY0921:
Near a new LOW record (1 month)
Type : Bearish
Timeframe : Weekly
The Central Volumes scanner notes the presence of abnormal volumes:
Abnormal volumes
Timeframe : 5 days
Abnormal volumes
Timeframe : 20 days
Abnormal volumes
Timeframe : 50 days
Technical
A technical analysis in 1H of this WHEAT ONLY0921 chart shows a sharp bearish trend. The signals given by moving averages are 92.86% bearish. This strong bearish trend is confirmed by the strong signals currently being given by short-term moving averages. An assessment of moving averages reveals several bearish signals that could impact this trend:
Bearish trend reversal : adaptative moving average 20
Type : Bearish
Timeframe : 1 hour
Bearish price crossover with Moving Average 20
Type : Bearish
Timeframe : 1 hour
Bearish price crossover with adaptative moving average 20
Type : Bearish
Timeframe : 1 hour
In fact, Central Analyzer took into account 18 technical indicators and the result was as follows: 5 are bullish, 4 are neutral and 9 are bearish. Caution: the Central Indicators scanner currently detects an excess:
CCI indicator is oversold : under -100
Type : Neutral
Timeframe : 1 hour
RSI indicator is back under 50
Type : Bearish
Timeframe : 1 hour
Price is back under the pivot point
Type : Bearish
Timeframe : Weekly
Momentum indicator is back under 0
Type : Bearish
Timeframe : 1 hour
Williams %R indicator is back under -50
Type : Bearish
Timeframe : 1 hour
The analysis of the price chart with Central Patterns scanners does not return any result.
No result was found by the Central Candlesticks scanner on Japanese candlesticks.
| S3 | S2 | S1 | Price | R1 | R2 | R3 | |
|---|---|---|---|---|---|---|---|
| ProTrendLines | 600.90 | 623.56 | 665.75 | 678.50 | 690.66 | 718.00 | 738.75 |
| Change (%) | -11.44% | -8.10% | -1.88% | - | +1.79% | +5.82% | +8.88% |
| Change | -77.60 | -54.94 | -12.75 | - | +12.16 | +39.50 | +60.25 |
| Level | Minor | Intermediate | Intermediate | - | Intermediate | Major | Minor |
To determine price objectives, it is also possible to use the pivot points. Here is the price position in relation to pivot points:
| Pivot points | S3 | S2 | S1 | PP | R1 | R2 | R3 |
|---|---|---|---|---|---|---|---|
| Standard | 656.75 | 665.50 | 672.00 | 680.75 | 687.25 | 696.00 | 702.50 |
| Camarilla | 674.31 | 675.70 | 677.10 | 678.50 | 679.90 | 681.30 | 682.69 |
| Woodie | 655.63 | 664.94 | 670.88 | 680.19 | 686.13 | 695.44 | 701.38 |
| Fibonacci | 665.50 | 671.33 | 674.93 | 680.75 | 686.58 | 690.18 | 696.00 |
| Pivot points | S3 | S2 | S1 | PP | R1 | R2 | R3 |
|---|---|---|---|---|---|---|---|
| Standard | 607.75 | 649.00 | 677.75 | 719.00 | 747.75 | 789.00 | 817.75 |
| Camarilla | 687.25 | 693.67 | 700.08 | 706.50 | 712.92 | 719.33 | 725.75 |
| Woodie | 601.50 | 645.88 | 671.50 | 715.88 | 741.50 | 785.88 | 811.50 |
| Fibonacci | 649.00 | 675.74 | 692.26 | 719.00 | 745.74 | 762.26 | 789.00 |
| Pivot points | S3 | S2 | S1 | PP | R1 | R2 | R3 |
|---|---|---|---|---|---|---|---|
| Standard | 482.00 | 545.75 | 639.00 | 702.75 | 796.00 | 859.75 | 953.00 |
| Camarilla | 689.08 | 703.47 | 717.86 | 732.25 | 746.64 | 761.03 | 775.43 |
| Woodie | 496.75 | 553.13 | 653.75 | 710.13 | 810.75 | 867.13 | 967.75 |
| Fibonacci | 545.75 | 605.72 | 642.78 | 702.75 | 762.72 | 799.78 | 859.75 |
Numerical data
The following is the status of technical indicators and moving averages registered at the time this technical analysis was created:
| RSI (14): | 38.96 | |
| MACD (12,26,9): | -2.4500 | |
| Directional Movement: | -13.18 | |
| AROON (14): | 21.43 | |
| DEMA (21): | 679.56 | |
| Parabolic SAR (0,02-0,02-0,2): | 674.85 | |
| Elder Ray (13): | -3.86 | |
| Super Trend (3,10): | 690.22 | |
| Zig ZAG (10): | 678.50 | |
| VORTEX (21): | 0.9600 | |
| Stochastique (14,3,5): | 44.26 | |
| TEMA (21): | 680.75 | |
| Williams %R (14): | -72.13 | |
| Chande Momentum Oscillator (20): | -7.75 | |
| Repulse (5,40,3): | -0.5700 | |
| ROCnROLL: | 2 | |
| TRIX (15,9): | -0.0500 | |
| Courbe Coppock: | 1.18 |
| MA7: | 699.14 | |
| MA20: | 719.91 | |
| MA50: | 669.43 | |
| MA100: | 655.03 | |
| MAexp7: | 681.28 | |
| MAexp20: | 682.67 | |
| MAexp50: | 688.42 | |
| MAexp100: | 697.68 | |
| Price / MA7: | -2.95% | |
| Price / MA20: | -5.75% | |
| Price / MA50: | +1.35% | |
| Price / MA100: | +3.58% | |
| Price / MAexp7: | -0.41% | |
| Price / MAexp20: | -0.61% | |
| Price / MAexp50: | -1.44% | |
| Price / MAexp100: | -2.75% |
About author

Online


Add a comment
Comments
0 comments on the analysis WHEAT ONLY0921 - 1H