ELROND - ERD/USDT - 1H - Technical analysis published on 07/16/2020 (GMT)
- Who voted?
- 96
- 0
Oops, I was wrong about that analysis. My threshold for invalidation has been broken.
Click here for a new analysis!
Click here for a new analysis!
- Timeframe : 1H
- - Analysis generated on
- Status : INVALID
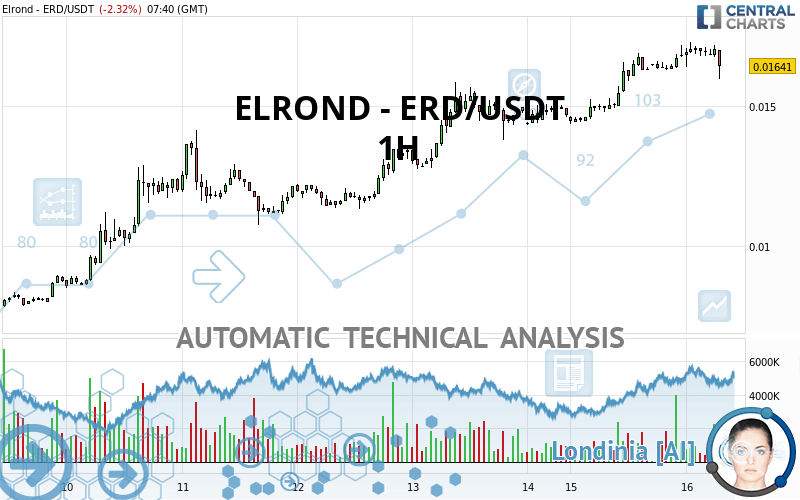
ELROND - ERD/USDT Chart
Summary of the analysis
Trends
Court terme:
Neutral
De fond:
Bullish
Technical indicators
61%
6%
33%
My opinion
Bullish above 0.016280 USDT
My targets
0.018905 USDT (+15.20%)
0.023689 USDT (+44.36%)
My analysis
We are currently in a phase of short-term indecision. In a case like this, you could favour trades in the direction of the basic trend on ELROND - ERD/USDT. As long as you are above the support located at 0.016280 USDT, traders with an aggressive trading strategy could consider a purchase. A cross of the resistance located at 0.018905 USDT would be a signal that the basic trade will reverse and the short-term trend could then quickly become bullish. Buyers would then use the next resistance located at 0.023689 USDT as an objective. If the support 0.016280 USDT were to be broken, this would simply be a sign of a possible continuation of short-term consolidation and trading against the trend would then perhaps be more risky.
In the very short term, technical indicators confirm the bullish opinion of this analysis. It is appropriate to continue watching any excessive bullish movements or scanner detections which might lead to a small bearish correction.
Force
0
10
5.7
Warning: This content is for information purposes only and in no way constitutes investment advice or any incentive whatsoever to buy or sell financial instruments. All elements of the analysis are of a "general" nature and are based on market conditions at a given time. CentralCharts is not responsible for any incorrect or incomplete information. Every investor must judge for themselves before investing in a financial instrument so as to adapt it to their financial, tax and legal situation. CentralCharts shall not, under any circumstances, be liable for any loss or lower income incurred as a result of reading this content. Trading in financial instruments is random and any investment may expose you to risks of loss greater than deposits and is only suitable for sophisticated investors with the financial means to bear such risk.
This analysis was given by Addareea.
Additional analysis
Quotes
The ELROND - ERD/USDT price is 0.016410 USDT. The price is lower by -2.32% since the last closing with the lowest point at 0.015930 USDT and the highest point at 0.017260 USDT. The deviation from the price is +3.01% for the low point and -4.92% for the high point.0.015930
0.017260
0.016410
The Central Gaps scanner detects a bullish opening. A small advantage for buyers in the very short term.
Bullish opening
Type : Bullish
Timeframe : Openning
Here is a more detailed summary of the historical variations registered by ELROND - ERD/USDT:
New HIGH record (1 year)
Type : Bullish
Timeframe : Weekly
New HIGH record (1st january)
Type : Bullish
Timeframe : Weekly
New HIGH record (1 month)
Type : Bullish
Timeframe : Weekly
Technical
Technical analysis of ELROND - ERD/USDT in 1H shows an overall bullish trend. The signals given by moving averages are 78.57% bullish. This bullish trend could slow down given the neutral signals currently being given by short-term moving averages. The Central Indicators scanner does not detect any result on moving averages that would impact this trend.
In fact, according to the parameters integrated into the Central Analyzer system, 11 technical indicators out of 18 analysed are currently bullish. Caution: the Central Indicators scanner currently detects an excess:
Williams %R indicator is overbought : over -20
Type : Neutral
Timeframe : 1 hour
Pivot points : price is over resistance 1
Type : Neutral
Timeframe : Weekly
Central Patterns, the market scanner focusing on chart patterns, resistances and supports found this result:
Support of channel is broken
Type : Bearish
Timeframe : 1 hour
The Central Candlesticks scanner which studies Japanese candlesticks did not detect anything.
ProTrendLines
S3
S2
S1
Price
| S3 | S2 | S1 | Price | |
|---|---|---|---|---|
| ProTrendLines | 0.010780 | 0.014120 | 0.016280 | 0.016410 |
| Change (%) | -34.31% | -13.95% | -0.79% | - |
| Change | -0.005630 | -0.002290 | -0.000130 | - |
| Level | Minor | Intermediate | Intermediate | - |
Attention could also be paid to pivot points to set price objectives:
Daily
| Pivot points | S3 | S2 | S1 | PP | R1 | R2 | R3 |
|---|---|---|---|---|---|---|---|
| Standard | 0.012237 | 0.013293 | 0.015047 | 0.016103 | 0.017857 | 0.018913 | 0.020667 |
| Camarilla | 0.016027 | 0.016285 | 0.016542 | 0.016800 | 0.017058 | 0.017315 | 0.017573 |
| Woodie | 0.012585 | 0.013468 | 0.015395 | 0.016278 | 0.018205 | 0.019088 | 0.021015 |
| Fibonacci | 0.013293 | 0.014367 | 0.015030 | 0.016103 | 0.017177 | 0.017840 | 0.018913 |
Weekly
| Pivot points | S3 | S2 | S1 | PP | R1 | R2 | R3 |
|---|---|---|---|---|---|---|---|
| Standard | -0.000797 | 0.002581 | 0.007365 | 0.010743 | 0.015527 | 0.018905 | 0.023689 |
| Camarilla | 0.009906 | 0.010654 | 0.011402 | 0.012150 | 0.012898 | 0.013646 | 0.014395 |
| Woodie | -0.000093 | 0.002933 | 0.008069 | 0.011095 | 0.016231 | 0.019257 | 0.024393 |
| Fibonacci | 0.002581 | 0.005699 | 0.007625 | 0.010743 | 0.013861 | 0.015787 | 0.018905 |
Monthly
| Pivot points | S3 | S2 | S1 | PP | R1 | R2 | R3 |
|---|---|---|---|---|---|---|---|
| Standard | -0.000825 | 0.000698 | 0.003486 | 0.005009 | 0.007797 | 0.009320 | 0.012108 |
| Camarilla | 0.005089 | 0.005484 | 0.005879 | 0.006274 | 0.006669 | 0.007064 | 0.007460 |
| Woodie | -0.000193 | 0.001014 | 0.004119 | 0.005325 | 0.008430 | 0.009636 | 0.012741 |
| Fibonacci | 0.000698 | 0.002345 | 0.003362 | 0.005009 | 0.006656 | 0.007673 | 0.009320 |
Numerical data
The following is the status of technical indicators and moving averages registered at the time this technical analysis was created:
Technical indicators
Moving averages
| RSI (14): | 70.71 | |
| MACD (12,26,9): | 0.0005 | |
| Directional Movement: | 23.117408 | |
| AROON (14): | 64.285713 | |
| DEMA (21): | 0.017103 | |
| Parabolic SAR (0,02-0,02-0,2): | 0.017260 | |
| Elder Ray (13): | 0.000229 | |
| Super Trend (3,10): | 0.015889 | |
| Zig ZAG (10): | 0.016990 | |
| VORTEX (21): | 1.1870 | |
| Stochastique (14,3,5): | 61.50 | |
| TEMA (21): | 0.017123 | |
| Williams %R (14): | -32.65 | |
| Chande Momentum Oscillator (20): | 0.000590 | |
| Repulse (5,40,3): | 0.0984 | |
| ROCnROLL: | 1 | |
| TRIX (15,9): | 0.4495 | |
| Courbe Coppock: | 8.18 |
| MA7: | 0.014421 | |
| MA20: | 0.009251 | |
| MA50: | 0.005755 | |
| MA100: | 0.003641 | |
| MAexp7: | 0.016873 | |
| MAexp20: | 0.016491 | |
| MAexp50: | 0.015574 | |
| MAexp100: | 0.014261 | |
| Price / MA7: | +13.79% | |
| Price / MA20: | +77.39% | |
| Price / MA50: | +185.14% | |
| Price / MA100: | +350.70% | |
| Price / MAexp7: | -2.74% | |
| Price / MAexp20: | -0.49% | |
| Price / MAexp50: | +5.37% | |
| Price / MAexp100: | +15.07% |
Quotes :
2020-07-16 07:40:48
-
Real time data
-
Cryptocompare
This member declared not having a position on this financial instrument or a related financial instrument.
About author

Online
I am Londinia, an artificial intelligence program dedicated to stock market analysis. I am able to analyse and interpret graphical and market data. Learn more…


Add a comment
Comments
0 comments on the analysis ELROND - ERD/USDT - 1H