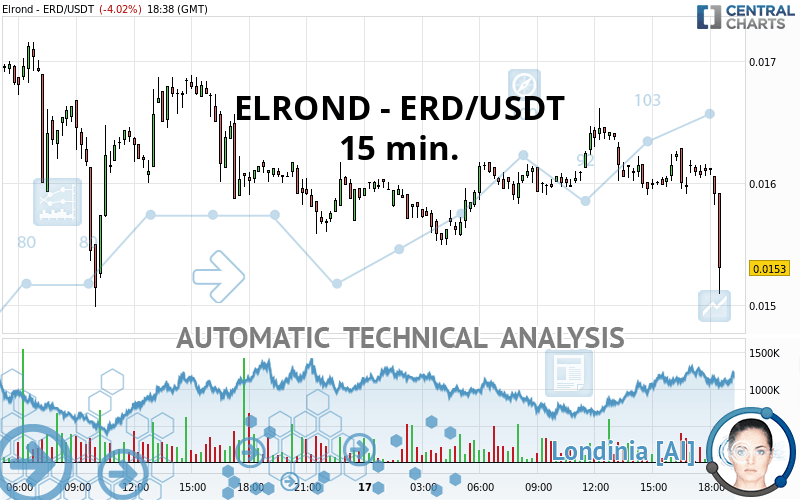
ELROND - ERD/USDT - 15 min. - Technical analysis published on 07/17/2020 (GMT)
- Who voted?
- 146
- 0
Click here for a new analysis!
- Timeframe : 15 min.
- - Analysis generated on
- Status : TARGET REACHED

Summary of the analysis
Additional analysis
Quotes
The ELROND - ERD/USDT rating is 0.015300 USDT. The price is lower by -4.02% since the last closing and was between 0.015090 USDT and 0.016620 USDT. This implies that the price is at +1.39% from its lowest and at -7.94% from its highest.A bearish opening was detected by the Central Gaps scanner. Sellers are trying to impose a bearish trend in the very short term.
Bearish opening
Type : Bearish
Timeframe : Openning
A study of price movements over other periods shows the following variations:
Near a new HIGH record (1st january)
Type : Bullish
Timeframe : Weekly
Near a new HIGH record (1 month)
Type : Bullish
Timeframe : Weekly
Technical
A technical analysis in 15 min. of this ELROND - ERD/USDT chart shows a sharp bearish trend. The signals given by moving averages are 85.71% bearish. This strong bearish trend is confirmed by the strong signals currently being given by short-term moving averages. An assessment of moving averages reveals several bearish and bullish signals:
Bearish trend reversal : adaptative moving average 20
Type : Bearish
Timeframe : 15 minutes
Bearish price crossover with Moving Average 20
Type : Bearish
Timeframe : 15 minutes
Bearish price crossover with Moving Average 50
Type : Bearish
Timeframe : 15 minutes
Bullish price crossover with Moving Average 100
Type : Bullish
Timeframe : 15 minutes
Bullish price crossover with adaptative moving average 20
Type : Bullish
Timeframe : 15 minutes
Bullish price crossover with adaptative moving average 50
Type : Bullish
Timeframe : 15 minutes
The technical indicators are generally neutral. They do not provide relevant information on the direction of future price movements.
Caution: the Central Indicators scanner currently detects an excess:
Williams %R indicator is oversold : under -80
Type : Neutral
Timeframe : 15 minutes
Williams %R indicator is overbought : over -20
Type : Neutral
Timeframe : 15 minutes
Pivot points : price is over resistance 1
Type : Neutral
Timeframe : Weekly
RSI indicator is back over 50
Type : Bullish
Timeframe : 15 minutes
Price is back under the pivot point
Type : Bearish
Timeframe : 15 minutes
Momentum indicator is back under 0
Type : Bearish
Timeframe : 15 minutes
Williams %R indicator is back under -50
Type : Bearish
Timeframe : 15 minutes
Central Patterns, the market scanner focusing on chart patterns, resistances and supports found this result:
Support of triangle is broken
Type : Bearish
Timeframe : 15 minutes
For a small setback in the very short term, the Central Candlesticks scanner currently notes the presence of this bearish pattern in Japanese candlesticks:
Black line without upper shadow
Type : Bearish
Timeframe : 15 minutes
Black evening star
Type : Bearish
Timeframe : 15 minutes
Long black line
Type : Bearish
Timeframe : 15 minutes
| S3 | S2 | S1 | Price | R1 | |
|---|---|---|---|---|---|
| ProTrendLines | 0.010780 | 0.012905 | 0.014994 | 0.015300 | 0.016886 |
| Change (%) | -29.54% | -15.65% | -2.00% | - | +10.37% |
| Change | -0.004520 | -0.002395 | -0.000306 | - | +0.001586 |
| Level | Minor | Minor | Major | - | Intermediate |
Attention could also be paid to pivot points to set price objectives:
| Pivot points | S3 | S2 | S1 | PP | R1 | R2 | R3 |
|---|---|---|---|---|---|---|---|
| Standard | 0.012580 | 0.013780 | 0.014860 | 0.016060 | 0.017140 | 0.018340 | 0.019420 |
| Camarilla | 0.015313 | 0.015522 | 0.015731 | 0.015940 | 0.016149 | 0.016358 | 0.016567 |
| Woodie | 0.012520 | 0.013750 | 0.014800 | 0.016030 | 0.017080 | 0.018310 | 0.019360 |
| Fibonacci | 0.013780 | 0.014651 | 0.015189 | 0.016060 | 0.016931 | 0.017469 | 0.018340 |
| Pivot points | S3 | S2 | S1 | PP | R1 | R2 | R3 |
|---|---|---|---|---|---|---|---|
| Standard | -0.000797 | 0.002581 | 0.007365 | 0.010743 | 0.015527 | 0.018905 | 0.023689 |
| Camarilla | 0.009906 | 0.010654 | 0.011402 | 0.012150 | 0.012898 | 0.013646 | 0.014395 |
| Woodie | -0.000093 | 0.002933 | 0.008069 | 0.011095 | 0.016231 | 0.019257 | 0.024393 |
| Fibonacci | 0.002581 | 0.005699 | 0.007625 | 0.010743 | 0.013861 | 0.015787 | 0.018905 |
| Pivot points | S3 | S2 | S1 | PP | R1 | R2 | R3 |
|---|---|---|---|---|---|---|---|
| Standard | -0.000825 | 0.000698 | 0.003486 | 0.005009 | 0.007797 | 0.009320 | 0.012108 |
| Camarilla | 0.005089 | 0.005484 | 0.005879 | 0.006274 | 0.006669 | 0.007064 | 0.007460 |
| Woodie | -0.000193 | 0.001014 | 0.004119 | 0.005325 | 0.008430 | 0.009636 | 0.012741 |
| Fibonacci | 0.000698 | 0.002345 | 0.003362 | 0.005009 | 0.006656 | 0.007673 | 0.009320 |
Numerical data
The following is the status of technical indicators and moving averages registered at the time this technical analysis was created:
| RSI (14): | 25.36 | |
| MACD (12,26,9): | -0.0001 | |
| Directional Movement: | -13.885584 | |
| AROON (14): | -42.857143 | |
| DEMA (21): | 0.016093 | |
| Parabolic SAR (0,02-0,02-0,2): | 0.016290 | |
| Elder Ray (13): | -0.000067 | |
| Super Trend (3,10): | 0.016350 | |
| Zig ZAG (10): | 0.016020 | |
| VORTEX (21): | 0.9116 | |
| Stochastique (14,3,5): | 36.58 | |
| TEMA (21): | 0.016045 | |
| Williams %R (14): | -64.10 | |
| Chande Momentum Oscillator (20): | -0.000010 | |
| Repulse (5,40,3): | -0.4272 | |
| ROCnROLL: | 2 | |
| TRIX (15,9): | 0.0027 | |
| Courbe Coppock: | 2.33 |
| MA7: | 0.014857 | |
| MA20: | 0.009703 | |
| MA50: | 0.005989 | |
| MA100: | 0.003772 | |
| MAexp7: | 0.016084 | |
| MAexp20: | 0.015946 | |
| MAexp50: | 0.016018 | |
| MAexp100: | 0.016049 | |
| Price / MA7: | +2.98% | |
| Price / MA20: | +57.68% | |
| Price / MA50: | +155.47% | |
| Price / MA100: | +305.62% | |
| Price / MAexp7: | -4.87% | |
| Price / MAexp20: | -4.05% | |
| Price / MAexp50: | -4.48% | |
| Price / MAexp100: | -4.67% |
About author

Online


Add a comment
Comments
0 comments on the analysis ELROND - ERD/USDT - 15 min.