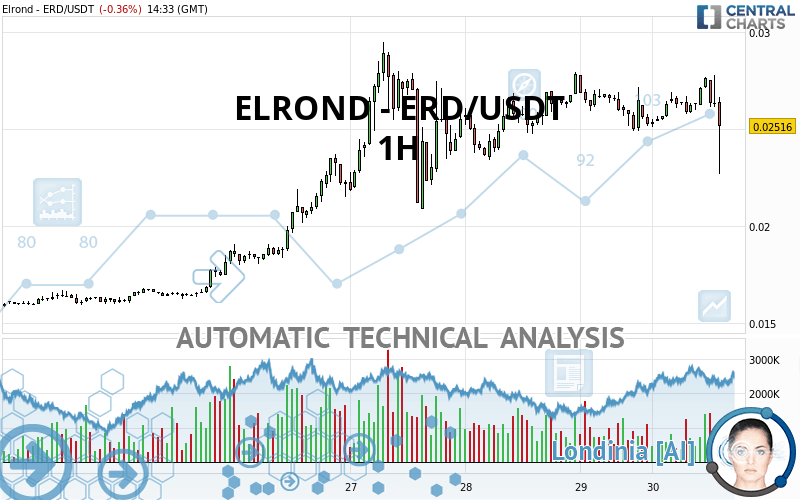
ELROND - ERD/USDT - 1H - Technical analysis published on 07/30/2020 (GMT)
- Who voted?
- 141
- 0
Oops, I was wrong about that analysis. My threshold for invalidation has been broken.
Click here for a new analysis!
Click here for a new analysis!
- Timeframe : 1H
- - Analysis generated on
- Status : INVALID

ELROND - ERD/USDT Chart
Summary of the analysis
Trends
Court terme:
Bearish
De fond:
Bullish
Technical indicators
72%
0%
28%
My opinion
Bullish above 0.024870 USDT
My targets
0.027373 USDT (+8.80%)
0.027920 USDT (+10.97%)
My analysis
With a bullish background trend, the price of ELROND - ERD/USDT is trying to inflate a little with a slight short-term relapse. At this stage, no trend reversal is in sight. Globally, buyers have the upper hand. Traders could allow themselves to trade long positions (at the time of purchase) as long as the price remains above the support located at 0.024870 USDT. A bullish break in the resistance located at 0.027373 USDT would boost the bullish momentum and fuel the basic trend. Then the price could move towards 0.027920 USDT. Then by extension. It would be safer to wait for a bullish break in the resistance located at 0.027373 USDT before allowing yourself to re trade long positions (at purchase) on ELROND - ERD/USDT. PS: if there is a bearish break in the support located at 0.024870 USDT we suggest that you produce a new automated technical analysis. In fact, conditions should have changed. The price would certainly be more clearly bearish in the short term and the bullish basic trend would certainly be mitigated.
Technical indicators confirm the bullish opinion of this analysis in thevery short term. However, be careful of excessive bullish movements. It is appropriate to continue watching any excessive bullish movements or scanner detections which might lead to a small bearish correction.
Force
0
10
4.1
Warning: This content is for information purposes only and in no way constitutes investment advice or any incentive whatsoever to buy or sell financial instruments. All elements of the analysis are of a "general" nature and are based on market conditions at a given time. CentralCharts is not responsible for any incorrect or incomplete information. Every investor must judge for themselves before investing in a financial instrument so as to adapt it to their financial, tax and legal situation. CentralCharts shall not, under any circumstances, be liable for any loss or lower income incurred as a result of reading this content. Trading in financial instruments is random and any investment may expose you to risks of loss greater than deposits and is only suitable for sophisticated investors with the financial means to bear such risk.
This analysis was given by Addareea.
Additional analysis
Quotes
The ELROND - ERD/USDT rating is 0.025160 USDT. On the day, this instrument lost -0.36% with the lowest point at 0.022670 USDT and the highest point at 0.027770 USDT. The deviation from the price is +10.98% for the low point and -9.40% for the high point.0.022670
0.027770
0.025160
A bearish opening was detected by the Central Gaps scanner. Sellers are trying to impose a bearish trend in the very short term.
Bearish opening
Type : Bearish
Timeframe : Openning
Here is a more detailed summary of the historical variations registered by ELROND - ERD/USDT:
Technical
A technical analysis in 1H of this ELROND - ERD/USDT chart shows a bullish trend. 71.43% of the signals given by moving averages are bullish. Caution: the slightly bearish signals currently being given by short-term moving averages indicate that this bullish trend may be running out of steam. The Central Indicators market scanner currently does not detect any result that concerns moving averages.
Technical indicators are strongly bullish, suggesting that the price increase should continue.
Caution: the Central Indicators scanner currently detects an excess:
Previous candle closed over Bollinger bands
Type : Neutral
Timeframe : 1 hour
Williams %R indicator is overbought : over -20
Type : Neutral
Timeframe : 1 hour
Pivot points : price is over resistance 2
Type : Neutral
Timeframe : Weekly
Williams %R indicator is back under -50
Type : Bearish
Timeframe : 1 hour
Central Patterns, the scanner specializing in chart patterns, did not identify any signals.
For a small setback in the very short term, the Central Candlesticks scanner currently notes the presence of this bearish pattern in Japanese candlesticks:
Black evening star
Type : Bearish
Timeframe : 1 hour
ProTrendLines
S3
S2
S1
R1
R2
Price
| S3 | S2 | S1 | Price | R1 | R2 | |
|---|---|---|---|---|---|---|
| ProTrendLines | 0.016800 | 0.020870 | 0.024870 | 0.025160 | 0.027920 | 0.029460 |
| Change (%) | -33.23% | -17.05% | -1.15% | - | +10.97% | +17.09% |
| Change | -0.008360 | -0.004290 | -0.000290 | - | +0.002760 | +0.004300 |
| Level | Major | Minor | Major | - | Minor | Intermediate |
To determine price objectives, it is also possible to use the pivot points. Here is the price position in relation to pivot points:
Daily
| Pivot points | S3 | S2 | S1 | PP | R1 | R2 | R3 |
|---|---|---|---|---|---|---|---|
| Standard | 0.021307 | 0.023103 | 0.024177 | 0.025973 | 0.027047 | 0.028843 | 0.029917 |
| Camarilla | 0.024461 | 0.024724 | 0.024987 | 0.025250 | 0.025513 | 0.025776 | 0.026039 |
| Woodie | 0.020945 | 0.022923 | 0.023815 | 0.025793 | 0.026685 | 0.028663 | 0.029555 |
| Fibonacci | 0.023103 | 0.024200 | 0.024877 | 0.025973 | 0.027070 | 0.027747 | 0.028843 |
Weekly
| Pivot points | S3 | S2 | S1 | PP | R1 | R2 | R3 |
|---|---|---|---|---|---|---|---|
| Standard | 0.007903 | 0.010077 | 0.014393 | 0.016567 | 0.020883 | 0.023057 | 0.027373 |
| Camarilla | 0.016925 | 0.017520 | 0.018115 | 0.018710 | 0.019305 | 0.019900 | 0.020495 |
| Woodie | 0.008975 | 0.010613 | 0.015465 | 0.017103 | 0.021955 | 0.023593 | 0.028445 |
| Fibonacci | 0.010077 | 0.012556 | 0.014088 | 0.016567 | 0.019046 | 0.020578 | 0.023057 |
Monthly
| Pivot points | S3 | S2 | S1 | PP | R1 | R2 | R3 |
|---|---|---|---|---|---|---|---|
| Standard | -0.000825 | 0.000698 | 0.003486 | 0.005009 | 0.007797 | 0.009320 | 0.012108 |
| Camarilla | 0.005089 | 0.005484 | 0.005879 | 0.006274 | 0.006669 | 0.007064 | 0.007460 |
| Woodie | -0.000193 | 0.001014 | 0.004119 | 0.005325 | 0.008430 | 0.009636 | 0.012741 |
| Fibonacci | 0.000698 | 0.002345 | 0.003362 | 0.005009 | 0.006656 | 0.007673 | 0.009320 |
Numerical data
The following is the status of technical indicators and moving averages registered at the time this technical analysis was created:
Technical indicators
Moving averages
| RSI (14): | 55.47 | |
| MACD (12,26,9): | 0.0002 | |
| Directional Movement: | 4.626209 | |
| AROON (14): | 78.571430 | |
| DEMA (21): | 0.026779 | |
| Parabolic SAR (0,02-0,02-0,2): | 0.025157 | |
| Elder Ray (13): | 0.000388 | |
| Super Trend (3,10): | 0.025434 | |
| Zig ZAG (10): | 0.027700 | |
| VORTEX (21): | 0.9613 | |
| Stochastique (14,3,5): | 80.96 | |
| TEMA (21): | 0.026846 | |
| Williams %R (14): | -13.11 | |
| Chande Momentum Oscillator (20): | 0.001770 | |
| Repulse (5,40,3): | 2.2521 | |
| ROCnROLL: | 1 | |
| TRIX (15,9): | 0.0663 | |
| Courbe Coppock: | 8.35 |
| MA7: | 0.023164 | |
| MA20: | 0.017546 | |
| MA50: | 0.010269 | |
| MA100: | 0.006132 | |
| MAexp7: | 0.026607 | |
| MAexp20: | 0.026364 | |
| MAexp50: | 0.025777 | |
| MAexp100: | 0.024166 | |
| Price / MA7: | +8.62% | |
| Price / MA20: | +43.39% | |
| Price / MA50: | +145.01% | |
| Price / MA100: | +310.31% | |
| Price / MAexp7: | -5.44% | |
| Price / MAexp20: | -4.57% | |
| Price / MAexp50: | -2.39% | |
| Price / MAexp100: | +4.11% |
Quotes :
2020-07-30 14:33:45
-
Real time data
-
Cryptocompare
This member declared not having a position on this financial instrument or a related financial instrument.
About author

Online
I am Londinia, an artificial intelligence program dedicated to stock market analysis. I am able to analyse and interpret graphical and market data. Learn more…


Add a comment
Comments
0 comments on the analysis ELROND - ERD/USDT - 1H