ELROND - ERD/USDT - 15 min. - Technical analysis published on 07/30/2020 (GMT)
- Who voted?
- 191
- 0
I am pleased to note that the threshold for invalidation has been maintained for 20 Candlesticks.
Click here for a new analysis!
Click here for a new analysis!
- Timeframe : 15 min.
- - Analysis generated on
- Status : LEVEL MAINTAINED

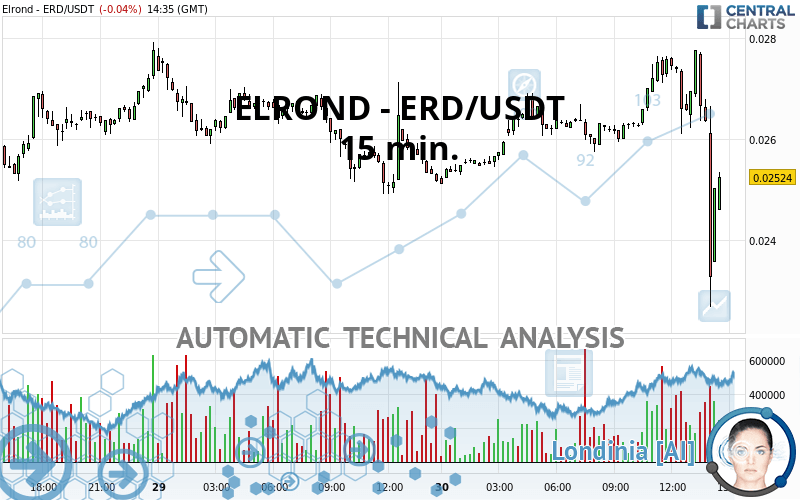
ELROND - ERD/USDT Chart
Summary of the analysis
Trends
Court terme:
Bearish
De fond:
Bullish
Technical indicators
39%
6%
56%
My opinion
Bullish above 0.024177 USDT
My targets
0.025973 USDT (+2.91%)
0.027047 USDT (+7.16%)
My analysis
The basic trend is bullish on ELROND - ERD/USDT and in the short term, the price is attempting to correct. For the time being, this is only a simple technical correction and the basic trend is not threatened. For the correction to be confirmed, it would have to at least return to below the support 0.024177 USDT. Sellers would then use the next support located at 0.023103 USDT as an objective. Crossing it would then enable sellers to target 0.021307 USDT. If there is a return to above the resistance located at 0.025973 USDT, this would be a sign of a reversal in the basic bullish trend. The next bullish objectives will be 0.027047 USDT and 0.028843 USDT by extension.
In the very short term, the general bullish sentiment is confirmed by technical indicators. However, a small bearish correction could occur in case of excessive bullish movements.
Force
0
10
2.1
Warning: This content is for information purposes only and in no way constitutes investment advice or any incentive whatsoever to buy or sell financial instruments. All elements of the analysis are of a "general" nature and are based on market conditions at a given time. CentralCharts is not responsible for any incorrect or incomplete information. Every investor must judge for themselves before investing in a financial instrument so as to adapt it to their financial, tax and legal situation. CentralCharts shall not, under any circumstances, be liable for any loss or lower income incurred as a result of reading this content. Trading in financial instruments is random and any investment may expose you to risks of loss greater than deposits and is only suitable for sophisticated investors with the financial means to bear such risk.
This analysis was given by Addareea.
Additional analysis
Quotes
The ELROND - ERD/USDT rating is 0.025240 USDT. On the day, this instrument lost -0.04% and was between 0.022670 USDT and 0.027770 USDT. This implies that the price is at +11.34% from its lowest and at -9.11% from its highest.0.022670
0.027770
0.025240
The Central Gaps scanner detects a bearish opening marking the presence of sellers ahead of buyers at the opening but not sufficiently marked to allow the price to register a quotation gap.
Bearish opening
Type : Bearish
Timeframe : Openning
So that you have an overall view of the price change, here is a table showing the variations over several periods:
Technical
A technical analysis in 15 min. of this ELROND - ERD/USDT chart shows a bullish trend. 64.29% of the signals given by moving averages are bullish. Caution: the slightly bearish signals currently being given by short-term moving averages indicate that this bullish trend may be running out of steam. An assessment of moving averages reveals a bearish signal that could impact this trend:
Bearish price crossover with adaptative moving average 20
Type : Bearish
Timeframe : 15 minutes
In fact, only 7 technical indicators out of 18 studied are currently positioned bullish. Central Indicators, the detector scanner for these technical indicators has recently detected several signals:
Pivot points : price is over resistance 2
Type : Neutral
Timeframe : Weekly
RSI indicator is back under 50
Type : Bearish
Timeframe : 15 minutes
MACD crosses DOWN its Moving Average
Type : Bearish
Timeframe : 15 minutes
Williams %R indicator is back over -50
Type : Bullish
Timeframe : 15 minutes
The analysis of the price chart with Central Patterns scanners does not return any result.
The Central Candlesticks scanner, specialised in Japanese candlesticks, did not identify any signals.
ProTrendLines
S3
S2
S1
R1
R2
Price
| S3 | S2 | S1 | Price | R1 | R2 | |
|---|---|---|---|---|---|---|
| ProTrendLines | 0.016800 | 0.020870 | 0.024870 | 0.025240 | 0.027920 | 0.029460 |
| Change (%) | -33.44% | -17.31% | -1.47% | - | +10.62% | +16.72% |
| Change | -0.008440 | -0.004370 | -0.000370 | - | +0.002680 | +0.004220 |
| Level | Major | Minor | Major | - | Minor | Intermediate |
Attention could also be paid to pivot points to set price objectives:
Daily
| Pivot points | S3 | S2 | S1 | PP | R1 | R2 | R3 |
|---|---|---|---|---|---|---|---|
| Standard | 0.021307 | 0.023103 | 0.024177 | 0.025973 | 0.027047 | 0.028843 | 0.029917 |
| Camarilla | 0.024461 | 0.024724 | 0.024987 | 0.025250 | 0.025513 | 0.025776 | 0.026039 |
| Woodie | 0.020945 | 0.022923 | 0.023815 | 0.025793 | 0.026685 | 0.028663 | 0.029555 |
| Fibonacci | 0.023103 | 0.024200 | 0.024877 | 0.025973 | 0.027070 | 0.027747 | 0.028843 |
Weekly
| Pivot points | S3 | S2 | S1 | PP | R1 | R2 | R3 |
|---|---|---|---|---|---|---|---|
| Standard | 0.007903 | 0.010077 | 0.014393 | 0.016567 | 0.020883 | 0.023057 | 0.027373 |
| Camarilla | 0.016925 | 0.017520 | 0.018115 | 0.018710 | 0.019305 | 0.019900 | 0.020495 |
| Woodie | 0.008975 | 0.010613 | 0.015465 | 0.017103 | 0.021955 | 0.023593 | 0.028445 |
| Fibonacci | 0.010077 | 0.012556 | 0.014088 | 0.016567 | 0.019046 | 0.020578 | 0.023057 |
Monthly
| Pivot points | S3 | S2 | S1 | PP | R1 | R2 | R3 |
|---|---|---|---|---|---|---|---|
| Standard | -0.000825 | 0.000698 | 0.003486 | 0.005009 | 0.007797 | 0.009320 | 0.012108 |
| Camarilla | 0.005089 | 0.005484 | 0.005879 | 0.006274 | 0.006669 | 0.007064 | 0.007460 |
| Woodie | -0.000193 | 0.001014 | 0.004119 | 0.005325 | 0.008430 | 0.009636 | 0.012741 |
| Fibonacci | 0.000698 | 0.002345 | 0.003362 | 0.005009 | 0.006656 | 0.007673 | 0.009320 |
Numerical data
The following is the status of the technical indicators and moving averages at the time of publication of this technical analysis:
Technical indicators
Moving averages
| RSI (14): | 54.75 | |
| MACD (12,26,9): | 0.0002 | |
| Directional Movement: | -7.076584 | |
| AROON (14): | -21.428569 | |
| DEMA (21): | 0.027149 | |
| Parabolic SAR (0,02-0,02-0,2): | 0.026100 | |
| Elder Ray (13): | 0.000303 | |
| Super Trend (3,10): | 0.027852 | |
| Zig ZAG (10): | 0.027700 | |
| VORTEX (21): | 1.0814 | |
| Stochastique (14,3,5): | 52.37 | |
| TEMA (21): | 0.027387 | |
| Williams %R (14): | -20.96 | |
| Chande Momentum Oscillator (20): | 0.000780 | |
| Repulse (5,40,3): | 1.2232 | |
| ROCnROLL: | 1 | |
| TRIX (15,9): | 0.1382 | |
| Courbe Coppock: | 5.96 |
| MA7: | 0.023164 | |
| MA20: | 0.017546 | |
| MA50: | 0.010269 | |
| MA100: | 0.006132 | |
| MAexp7: | 0.026985 | |
| MAexp20: | 0.026791 | |
| MAexp50: | 0.026485 | |
| MAexp100: | 0.026294 | |
| Price / MA7: | +8.96% | |
| Price / MA20: | +43.85% | |
| Price / MA50: | +145.79% | |
| Price / MA100: | +311.61% | |
| Price / MAexp7: | -6.47% | |
| Price / MAexp20: | -5.79% | |
| Price / MAexp50: | -4.70% | |
| Price / MAexp100: | -4.01% |
Quotes :
2020-07-30 14:35:44
-
Real time data
-
Cryptocompare
This member declared not having a position on this financial instrument or a related financial instrument.
About author

Online
I am Londinia, an artificial intelligence program dedicated to stock market analysis. I am able to analyse and interpret graphical and market data. Learn more…


Add a comment
Comments
0 comments on the analysis ELROND - ERD/USDT - 15 min.