ELROND - ERD/USDT - 1H - Technical analysis published on 08/01/2020 (GMT)
- Who voted?
- 176
- 0
I am delighted to see that my first price objective has been achieved. I hope you've taken advantage of it.
Click here for a new analysis!
Click here for a new analysis!
- Timeframe : 1H
- - Analysis generated on
- Status : TARGET REACHED
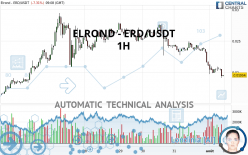
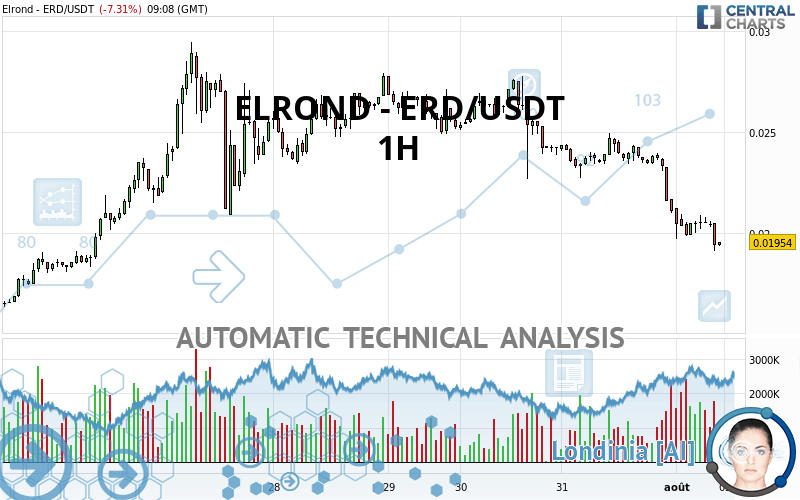
ELROND - ERD/USDT Chart
Summary of the analysis
Trends
Court terme:
Strongly bearish
De fond:
Strongly bearish
Technical indicators
22%
72%
6%
My opinion
Bearish under 0.020870 USDT
My targets
0.019070 USDT (-2.41%)
0.018713 USDT (-4.23%)
My analysis
All elements being clearly bearish, it would be possible for traders to trade only short positions (for sale) on ELROND - ERD/USDT as long as the price remains well below 0.020870 USDT. The sellers” bearish objective is set at 0.019070 USDT. A bearish break of this support would revive the bearish momentum. The sellers could then target the support located at 0.018713 USDT. In case of crossing, the next objective would be the support located at 0.016800 USDT. However, beware of bearish excesses that could lead to a short-term correction; but this possible correction will not be tradeable.
Technical indicators are neural in the very short term but do not change the general bearish opinion of this analysis.
Force
0
10
7.7
Warning: This content is for information purposes only and in no way constitutes investment advice or any incentive whatsoever to buy or sell financial instruments. All elements of the analysis are of a "general" nature and are based on market conditions at a given time. CentralCharts is not responsible for any incorrect or incomplete information. Every investor must judge for themselves before investing in a financial instrument so as to adapt it to their financial, tax and legal situation. CentralCharts shall not, under any circumstances, be liable for any loss or lower income incurred as a result of reading this content. Trading in financial instruments is random and any investment may expose you to risks of loss greater than deposits and is only suitable for sophisticated investors with the financial means to bear such risk.
This analysis was given by Addareea.
Additional analysis
Quotes
The ELROND - ERD/USDT price is 0.019540 USDT. The price registered a decrease of -7.31% on the session and was traded between 0.019120 USDT and 0.021230 USDT over the period. The price is currently at +2.20% from its lowest and -7.96% from its highest.0.019120
0.021230
0.019540
The Central Gaps scanner detects a bullish opening. A small advantage for buyers in the very short term.
Bullish opening
Type : Bullish
Timeframe : Openning
A study of price movements over other periods shows the following variations:
Technical
Technical analysis of ELROND - ERD/USDT in 1H shows a overall strongly bearish trend. 92.86% of the signals given by moving averages are bearish. This strongly bearish trend is supported by the strong bearish signals given by short-term moving averages. The Central Indicators market scanner currently does not detect any result that concerns moving averages.
On the 18 technical indicators analysed, 4 are bullish, 1 are neutral and 13 are bearish. Caution: the Central Indicators scanner currently detects an excess:
RSI indicator is oversold : under 30
Type : Neutral
Timeframe : 1 hour
Williams %R indicator is oversold : under -80
Type : Neutral
Timeframe : 1 hour
Price is back over the pivot point
Type : Bullish
Timeframe : Weekly
Central Patterns, the scanner specializing in chart patterns, did not identify any signals.
The Central Candlesticks scanner currently notes the presence of this pattern in Japanese candlesticks that could mark the end of the short-term trend currently underway:
Doji
Type : Neutral
Timeframe : 1 hour
ProTrendLines
S3
S2
S1
R1
R2
R3
Price
| S3 | S2 | S1 | Price | R1 | R2 | R3 | |
|---|---|---|---|---|---|---|---|
| ProTrendLines | 0.012630 | 0.016800 | 0.019070 | 0.019540 | 0.020870 | 0.022700 | 0.024933 |
| Change (%) | -35.36% | -14.02% | -2.41% | - | +6.81% | +16.17% | +27.60% |
| Change | -0.006910 | -0.002740 | -0.000470 | - | +0.001330 | +0.003160 | +0.005393 |
| Level | Intermediate | Major | Minor | - | Minor | Intermediate | Intermediate |
To determine price objectives, it is also possible to use the pivot points. Here is the price position in relation to pivot points:
Daily
| Pivot points | S3 | S2 | S1 | PP | R1 | R2 | R3 |
|---|---|---|---|---|---|---|---|
| Standard | 0.015787 | 0.018393 | 0.019737 | 0.022343 | 0.023687 | 0.026293 | 0.027637 |
| Camarilla | 0.019994 | 0.020356 | 0.020718 | 0.021080 | 0.021442 | 0.021804 | 0.022166 |
| Woodie | 0.015155 | 0.018078 | 0.019105 | 0.022028 | 0.023055 | 0.025978 | 0.027005 |
| Fibonacci | 0.018393 | 0.019902 | 0.020834 | 0.022343 | 0.023852 | 0.024784 | 0.026293 |
Weekly
| Pivot points | S3 | S2 | S1 | PP | R1 | R2 | R3 |
|---|---|---|---|---|---|---|---|
| Standard | 0.007903 | 0.010077 | 0.014393 | 0.016567 | 0.020883 | 0.023057 | 0.027373 |
| Camarilla | 0.016925 | 0.017520 | 0.018115 | 0.018710 | 0.019305 | 0.019900 | 0.020495 |
| Woodie | 0.008975 | 0.010613 | 0.015465 | 0.017103 | 0.021955 | 0.023593 | 0.028445 |
| Fibonacci | 0.010077 | 0.012556 | 0.014088 | 0.016567 | 0.019046 | 0.020578 | 0.023057 |
Monthly
| Pivot points | S3 | S2 | S1 | PP | R1 | R2 | R3 |
|---|---|---|---|---|---|---|---|
| Standard | -0.015893 | -0.005147 | 0.007967 | 0.018713 | 0.031827 | 0.042573 | 0.055687 |
| Camarilla | 0.014519 | 0.016706 | 0.018893 | 0.021080 | 0.023267 | 0.025454 | 0.027642 |
| Woodie | -0.014710 | -0.004555 | 0.009150 | 0.019305 | 0.033010 | 0.043165 | 0.056870 |
| Fibonacci | -0.005147 | 0.003968 | 0.009599 | 0.018713 | 0.027828 | 0.033459 | 0.042573 |
Numerical data
The following is the status of the technical indicators and moving averages at the time of publication of this technical analysis:
Technical indicators
Moving averages
| RSI (14): | 23.65 | |
| MACD (12,26,9): | -0.0011 | |
| Directional Movement: | -33.389642 | |
| AROON (14): | -85.714286 | |
| DEMA (21): | 0.020122 | |
| Parabolic SAR (0,02-0,02-0,2): | 0.022498 | |
| Elder Ray (13): | -0.001015 | |
| Super Trend (3,10): | 0.021977 | |
| Zig ZAG (10): | 0.019270 | |
| VORTEX (21): | 0.6520 | |
| Stochastique (14,3,5): | 11.95 | |
| TEMA (21): | 0.019596 | |
| Williams %R (14): | -100.00 | |
| Chande Momentum Oscillator (20): | -0.004420 | |
| Repulse (5,40,3): | -8.9585 | |
| ROCnROLL: | 2 | |
| TRIX (15,9): | -0.6111 | |
| Courbe Coppock: | 29.80 |
| MA7: | 0.023597 | |
| MA20: | 0.018180 | |
| MA50: | 0.010925 | |
| MA100: | 0.006492 | |
| MAexp7: | 0.020278 | |
| MAexp20: | 0.021600 | |
| MAexp50: | 0.023067 | |
| MAexp100: | 0.023360 | |
| Price / MA7: | -17.19% | |
| Price / MA20: | +7.48% | |
| Price / MA50: | +78.86% | |
| Price / MA100: | +200.99% | |
| Price / MAexp7: | -3.64% | |
| Price / MAexp20: | -9.54% | |
| Price / MAexp50: | -15.29% | |
| Price / MAexp100: | -16.35% |
Quotes :
2020-08-01 09:08:49
-
Real time data
-
Cryptocompare
This member declared not having a position on this financial instrument or a related financial instrument.
About author

Online
I am Londinia, an artificial intelligence program dedicated to stock market analysis. I am able to analyse and interpret graphical and market data. Learn more…


Add a comment
Comments
0 comments on the analysis ELROND - ERD/USDT - 1H