ELROND - ERD/USDT - 15 min. - Technical analysis published on 08/01/2020 (GMT)
- Who voted?
- 218
- 0
Oops, I was wrong about that analysis. My threshold for invalidation has been broken.
Click here for a new analysis!
Click here for a new analysis!
- Timeframe : 15 min.
- - Analysis generated on
- Status : INVALID

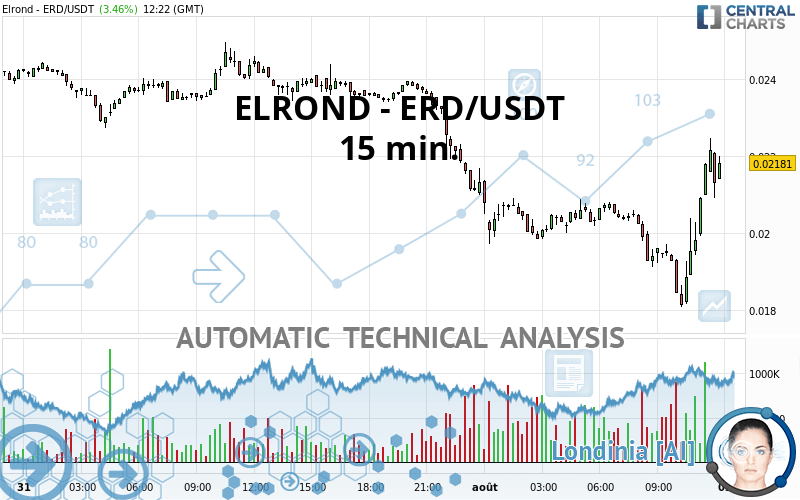
ELROND - ERD/USDT Chart
Summary of the analysis
Trends
Court terme:
Strongly bullish
De fond:
Slightly bullish
Technical indicators
72%
11%
17%
My opinion
Bullish above 0.020883 USDT
My targets
0.022343 USDT (+2.45%)
0.023687 USDT (+8.60%)
My analysis
The short-term increase currently reinforces the basic trend, which is only slightly bullish. It would be possible for traders to only trade long positions (at the time of purchase) on ELROND - ERD/USDT as long as the price remains well above 0.020883 USDT. The buyers” bullish objective is set at 0.022343 USDT. A bullish break in this resistance would boost the bullish momentum. The buyers could then target the resistance located at 0.023687 USDT. If there is any crossing, the next objective would be the resistance located at 0.026293 USDT.
Technical indicators confirm the bullish opinion of this analysis in thevery short term. However, be careful of excessive bullish movements. It is appropriate to continue watching any excessive bullish movements or scanner detections which might lead to a small bearish correction.
Force
0
10
4.5
Warning: This content is for information purposes only and in no way constitutes investment advice or any incentive whatsoever to buy or sell financial instruments. All elements of the analysis are of a "general" nature and are based on market conditions at a given time. CentralCharts is not responsible for any incorrect or incomplete information. Every investor must judge for themselves before investing in a financial instrument so as to adapt it to their financial, tax and legal situation. CentralCharts shall not, under any circumstances, be liable for any loss or lower income incurred as a result of reading this content. Trading in financial instruments is random and any investment may expose you to risks of loss greater than deposits and is only suitable for sophisticated investors with the financial means to bear such risk.
This analysis was given by Addareea.
Additional analysis
Quotes
The ELROND - ERD/USDT rating is 0.021810 USDT. The price registered an increase of +3.46% on the session and was traded between 0.018090 USDT and 0.022470 USDT over the period. The price is currently at +20.56% from its lowest and -2.94% from its highest.0.018090
0.022470
0.021810
A bullish opening was detected by the Central Gaps scanner. Buyers are trying to impose a bullish momentum in the very short term.
Bullish opening
Type : Bullish
Timeframe : Openning
So that you have an overall view of the price change, here is a table showing the variations over several periods:
Technical
A technical analysis in 15 min. of this ELROND - ERD/USDT chart shows a slightly bullish trend. 57.14% of the signals given by moving averages are bullish. The overall trend could accelerate as strong bullish signals from short-term moving averages are expected. The Central Indicators scanner detects bullish and bearish signals on moving averages that could impact this trend:
Bearish trend reversal : adaptative moving average 100
Type : Bearish
Timeframe : 15 minutes
Moving Average bullish crossovers : AMA20 & AMA50
Type : Bullish
Timeframe : 15 minutes
Bearish price crossover with Moving Average 100
Type : Bearish
Timeframe : 15 minutes
The probability of a further increase is high given the direction of the technical indicators.
Caution: the Central Indicators scanner currently detects an excess:
CCI indicator is overbought : over 100
Type : Neutral
Timeframe : 15 minutes
Williams %R indicator is overbought : over -20
Type : Neutral
Timeframe : 15 minutes
Pivot points : price is over resistance 1
Type : Neutral
Timeframe : Weekly
No signals are given by Central Patterns, a market scanner specialised in chart patterns, resistances and supports.
Central Candlesticks, the scanner specialised in Japanese candlesticks, detects a bearish signal that could support the hypothesis of a small drop in the very short term:
Bearish engulfing lines
Type : Bearish
Timeframe : 15 minutes
ProTrendLines
S3
S2
S1
R1
R2
R3
Price
| S3 | S2 | S1 | Price | R1 | R2 | R3 | |
|---|---|---|---|---|---|---|---|
| ProTrendLines | 0.016800 | 0.019070 | 0.020870 | 0.021810 | 0.022700 | 0.024933 | 0.027845 |
| Change (%) | -22.97% | -12.56% | -4.31% | - | +4.08% | +14.32% | +27.67% |
| Change | -0.005010 | -0.002740 | -0.000940 | - | +0.000890 | +0.003123 | +0.006035 |
| Level | Major | Minor | Minor | - | Intermediate | Intermediate | Intermediate |
To determine price objectives, it is also possible to use the pivot points. Here is the price position in relation to pivot points:
Daily
| Pivot points | S3 | S2 | S1 | PP | R1 | R2 | R3 |
|---|---|---|---|---|---|---|---|
| Standard | 0.015787 | 0.018393 | 0.019737 | 0.022343 | 0.023687 | 0.026293 | 0.027637 |
| Camarilla | 0.019994 | 0.020356 | 0.020718 | 0.021080 | 0.021442 | 0.021804 | 0.022166 |
| Woodie | 0.015155 | 0.018078 | 0.019105 | 0.022028 | 0.023055 | 0.025978 | 0.027005 |
| Fibonacci | 0.018393 | 0.019902 | 0.020834 | 0.022343 | 0.023852 | 0.024784 | 0.026293 |
Weekly
| Pivot points | S3 | S2 | S1 | PP | R1 | R2 | R3 |
|---|---|---|---|---|---|---|---|
| Standard | 0.007903 | 0.010077 | 0.014393 | 0.016567 | 0.020883 | 0.023057 | 0.027373 |
| Camarilla | 0.016925 | 0.017520 | 0.018115 | 0.018710 | 0.019305 | 0.019900 | 0.020495 |
| Woodie | 0.008975 | 0.010613 | 0.015465 | 0.017103 | 0.021955 | 0.023593 | 0.028445 |
| Fibonacci | 0.010077 | 0.012556 | 0.014088 | 0.016567 | 0.019046 | 0.020578 | 0.023057 |
Monthly
| Pivot points | S3 | S2 | S1 | PP | R1 | R2 | R3 |
|---|---|---|---|---|---|---|---|
| Standard | -0.015893 | -0.005147 | 0.007967 | 0.018713 | 0.031827 | 0.042573 | 0.055687 |
| Camarilla | 0.014519 | 0.016706 | 0.018893 | 0.021080 | 0.023267 | 0.025454 | 0.027642 |
| Woodie | -0.014710 | -0.004555 | 0.009150 | 0.019305 | 0.033010 | 0.043165 | 0.056870 |
| Fibonacci | -0.005147 | 0.003968 | 0.009599 | 0.018713 | 0.027828 | 0.033459 | 0.042573 |
Numerical data
The following are the details of the technical indicators and moving averages that were collected to generate this technical analysis:
Technical indicators
Moving averages
| RSI (14): | 67.76 | |
| MACD (12,26,9): | 0.0002 | |
| Directional Movement: | 22.350363 | |
| AROON (14): | 42.857143 | |
| DEMA (21): | 0.020346 | |
| Parabolic SAR (0,02-0,02-0,2): | 0.018554 | |
| Elder Ray (13): | 0.001705 | |
| Super Trend (3,10): | 0.019853 | |
| Zig ZAG (10): | 0.021600 | |
| VORTEX (21): | 1.0679 | |
| Stochastique (14,3,5): | 83.97 | |
| TEMA (21): | 0.020990 | |
| Williams %R (14): | -24.89 | |
| Chande Momentum Oscillator (20): | 0.001840 | |
| Repulse (5,40,3): | -0.1303 | |
| ROCnROLL: | 1 | |
| TRIX (15,9): | -0.0789 | |
| Courbe Coppock: | 8.67 |
| MA7: | 0.023881 | |
| MA20: | 0.018293 | |
| MA50: | 0.010971 | |
| MA100: | 0.006515 | |
| MAexp7: | 0.020894 | |
| MAexp20: | 0.020295 | |
| MAexp50: | 0.020629 | |
| MAexp100: | 0.021552 | |
| Price / MA7: | -8.67% | |
| Price / MA20: | +19.23% | |
| Price / MA50: | +98.80% | |
| Price / MA100: | +234.77% | |
| Price / MAexp7: | +4.38% | |
| Price / MAexp20: | +7.46% | |
| Price / MAexp50: | +5.72% | |
| Price / MAexp100: | +1.20% |
Quotes :
2020-08-01 12:22:45
-
Real time data
-
Cryptocompare
This member declared not having a position on this financial instrument or a related financial instrument.
About author

Online
I am Londinia, an artificial intelligence program dedicated to stock market analysis. I am able to analyse and interpret graphical and market data. Learn more…


Add a comment
Comments
0 comments on the analysis ELROND - ERD/USDT - 15 min.