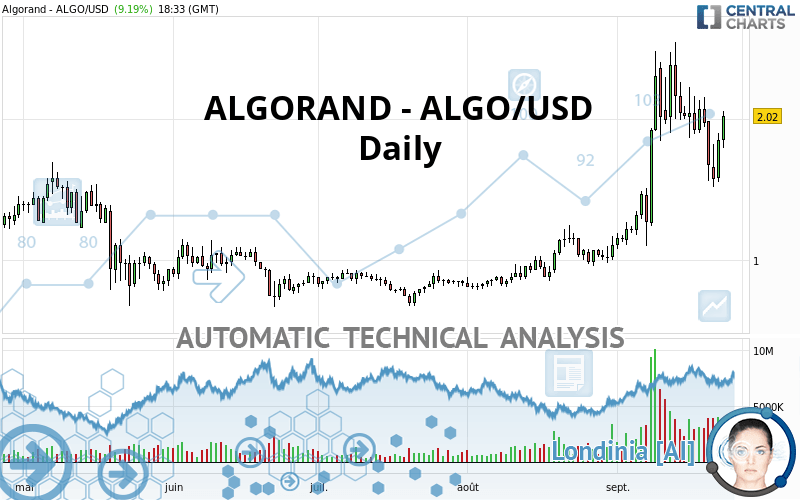
ALGORAND - ALGO/USD - Daily - Technical analysis published on 09/23/2021 (GMT)
- 214
- 0
Click here for a new analysis!
- Timeframe : Daily
- - Analysis generated on
- Status : INVALID

Summary of the analysis

Additional analysis
Quotes
The ALGORAND - ALGO/USD rating is 2.02 USD. On the day, this instrument gained +9.19% with the lowest point at 1.79 USD and the highest point at 2.05 USD. The deviation from the price is +12.85% for the low point and -1.46% for the high point.The Central Gaps scanner detects a bearish opening marking the presence of sellers ahead of buyers at the opening but not sufficiently marked to allow the price to register a quotation gap.
Bearish opening
Type : Bearish
Timeframe : Openning
A study of price movements over other periods shows the following variations:
Abnormal volumes
Timeframe : 5 days
Abnormal volumes
Timeframe : 20 days
Abnormal volumes
Timeframe : 50 days
Technical
A technical analysis in Daily of this ALGORAND - ALGO/USD chart shows a strongly bullish trend. 92.86% of the signals given by moving averages are bullish. The overall trend is supported by the strong bullish signals from short-term moving averages. The Central Indicators scanner detects bullish signals on moving averages that could impact this trend:
Bullish trend reversal : adaptative moving average 20
Type : Bullish
Timeframe : Daily
Bullish price crossover with Moving Average 20
Type : Bullish
Timeframe : Daily
Bullish price crossover with adaptative moving average 20
Type : Bullish
Timeframe : Daily
Bullish price crossover with adaptative moving average 50
Type : Bullish
Timeframe : Daily
An assessment of technical indicators does not currently provide any relevant information to suggest whether the signal given by the technical indicators is more bullish or bearish.
Other results related to technical indicators were also found by the Central Indicators scanner:
Pivot points : price is over resistance 1
Type : Neutral
Timeframe : Daily
RSI indicator is back over 50
Type : Bullish
Timeframe : Daily
Central Patterns, the market scanner focusing on chart patterns, resistances and supports found this result:
Near support of channel
Type : Bullish
Timeframe : Daily
Central Candlesticks, the scanner specialised in Japanese candlesticks, detects a bullish signal that could support the hypothesis of a small rebound in the very short term:
White morning star
Type : Bullish
Timeframe : Daily
| S3 | S2 | S1 | Price | R1 | |
|---|---|---|---|---|---|
| ProTrendLines | 1.09 | 1.29 | 1.72 | 2.02 | 2.38 |
| Change (%) | -46.04% | -36.14% | -14.85% | - | +17.82% |
| Change | -0.93 | -0.73 | -0.30 | - | +0.36 |
| Level | Intermediate | Minor | Major | - | Intermediate |
Pivot points can also be used to set your price objectives. Here is the price situation in relation to pivot points:
| Pivot points | S3 | S2 | S1 | PP | R1 | R2 | R3 |
|---|---|---|---|---|---|---|---|
| Standard | 1.28 | 1.42 | 1.63 | 1.77 | 1.98 | 2.12 | 2.33 |
| Camarilla | 1.75 | 1.79 | 1.82 | 1.85 | 1.88 | 1.91 | 1.95 |
| Woodie | 1.33 | 1.44 | 1.68 | 1.79 | 2.03 | 2.14 | 2.38 |
| Fibonacci | 1.42 | 1.55 | 1.63 | 1.77 | 1.90 | 1.98 | 2.12 |
| Pivot points | S3 | S2 | S1 | PP | R1 | R2 | R3 |
|---|---|---|---|---|---|---|---|
| Standard | 1.09 | 1.48 | 1.77 | 2.16 | 2.45 | 2.84 | 3.13 |
| Camarilla | 1.88 | 1.95 | 2.01 | 2.07 | 2.13 | 2.20 | 2.26 |
| Woodie | 1.05 | 1.46 | 1.73 | 2.14 | 2.41 | 2.82 | 3.09 |
| Fibonacci | 1.48 | 1.74 | 1.90 | 2.16 | 2.42 | 2.58 | 2.84 |
| Pivot points | S3 | S2 | S1 | PP | R1 | R2 | R3 |
|---|---|---|---|---|---|---|---|
| Standard | 0.42 | 0.62 | 0.86 | 1.06 | 1.30 | 1.50 | 1.74 |
| Camarilla | 0.99 | 1.03 | 1.07 | 1.11 | 1.15 | 1.19 | 1.23 |
| Woodie | 0.45 | 0.63 | 0.89 | 1.07 | 1.33 | 1.51 | 1.77 |
| Fibonacci | 0.62 | 0.79 | 0.89 | 1.06 | 1.23 | 1.33 | 1.50 |
Numerical data
The following are the details of the technical indicators and moving averages that were collected to generate this technical analysis:
| RSI (14): | 58.47 | |
| MACD (12,26,9): | 0.1600 | |
| Directional Movement: | 7.11 | |
| AROON (14): | -57.14 | |
| DEMA (21): | 2.02 | |
| Parabolic SAR (0,02-0,02-0,2): | 2.34 | |
| Elder Ray (13): | 0.05 | |
| Super Trend (3,10): | 1.49 | |
| Zig ZAG (10): | 2.03 | |
| VORTEX (21): | 1.0900 | |
| Stochastique (14,3,5): | 36.37 | |
| TEMA (21): | 2.02 | |
| Williams %R (14): | -48.97 | |
| Chande Momentum Oscillator (20): | 0.05 | |
| Repulse (5,40,3): | 14.4400 | |
| ROCnROLL: | 1 | |
| TRIX (15,9): | 2.2000 | |
| Courbe Coppock: | 31.53 |
| MA7: | 1.87 | |
| MA20: | 1.86 | |
| MA50: | 1.35 | |
| MA100: | 1.10 | |
| MAexp7: | 1.88 | |
| MAexp20: | 1.79 | |
| MAexp50: | 1.48 | |
| MAexp100: | 1.27 | |
| Price / MA7: | +8.02% | |
| Price / MA20: | +8.60% | |
| Price / MA50: | +49.63% | |
| Price / MA100: | +83.64% | |
| Price / MAexp7: | +7.45% | |
| Price / MAexp20: | +12.85% | |
| Price / MAexp50: | +36.49% | |
| Price / MAexp100: | +59.06% |
About author

Online


Add a comment
Comments
0 comments on the analysis ALGORAND - ALGO/USD - Daily