AERIE PHARMACEUTICALS INC. - Daily - Technical analysis published on 01/24/2020 (GMT)
- Who voted?
- 258
- 0
- Timeframe : Daily
- - Analysis generated on
- Status : NEUTRAL

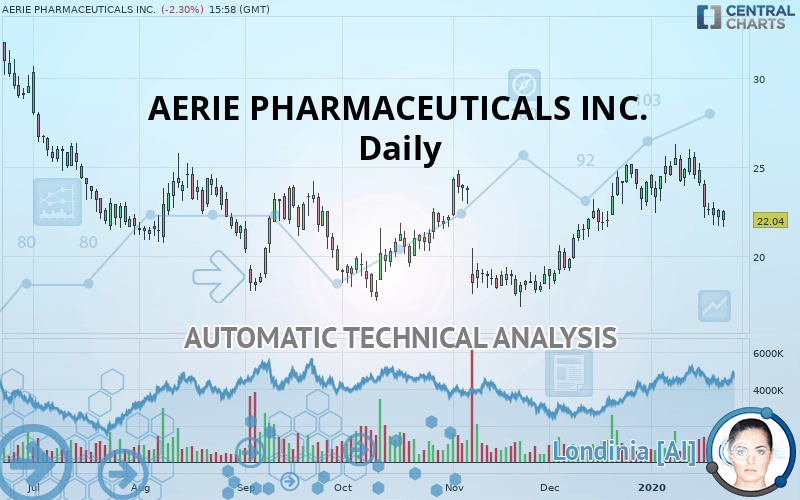
AERIE PHARMACEUTICALS INC. Chart
Summary of the analysis
Trends
Court terme:
Bearish
De fond:
Neutral
Technical indicators
17%
67%
17%
My opinion
Neutral between 21.26 USD and 22.50 USD
My targets
-
My analysis
There is no basic trend for AERIE PHARMACEUTICALS INC. and in the short term, there are still few sellers. It is difficult to advise a trading direction under these conditions. The first support is located at 21.26 USD. The first resistance is located at 22.50 USD. You could remain on the sidelines waiting for a more pronounced price movement on this instrument. A new analysis could then be carried out to provide clearer signals.
In the very short term, despite the neutral opinion of this analysis, technical indicators are bearish and could soon allow change to a bearish sentiment.
Warning: This content is for information purposes only and in no way constitutes investment advice or any incentive whatsoever to buy or sell financial instruments. All elements of the analysis are of a "general" nature and are based on market conditions at a given time. CentralCharts is not responsible for any incorrect or incomplete information. Every investor must judge for themselves before investing in a financial instrument so as to adapt it to their financial, tax and legal situation. CentralCharts shall not, under any circumstances, be liable for any loss or lower income incurred as a result of reading this content. Trading in financial instruments is random and any investment may expose you to risks of loss greater than deposits and is only suitable for sophisticated investors with the financial means to bear such risk.
This analysis was given by Vincent Launay.
Additional analysis
Quotes
The AERIE PHARMACEUTICALS INC. price is 22.04 USD. On the day, this instrument lost -2.31% and was between 21.62 USD and 22.59 USD. This implies that the price is at +1.94% from its lowest and at -2.43% from its highest.21.62
22.59
22.04
The Central Gaps scanner detects a bearish opening. A small advantage for sellers in the very short term.
Bearish opening
Type : Bearish
Timeframe : Openning
Here is a more detailed summary of the historical variations registered by AERIE PHARMACEUTICALS INC.:
Technical
Technical analysis of AERIE PHARMACEUTICALS INC. in Daily shows a neutral overall trend. The slightly bearish signals currently given by short-term moving averages could allow the overall trend to return to a slightly bearish trend. The Central Indicators scanner does not detect any result on moving averages that would impact this trend.
In fact, 12 technical indicators on 18 studied are currently positioned bearish. But beware of excesses. The Central Indicators scanner currently detects this:
CCI indicator is oversold : under -100
Type : Neutral
Timeframe : Daily
Williams %R indicator is oversold : under -80
Type : Neutral
Timeframe : Daily
Price is back over the pivot point
Type : Bullish
Timeframe : Daily
Price is back under the pivot point
Type : Bearish
Timeframe : Weekly
Central Patterns, the market scanner focusing on chart patterns, resistances and supports found this result:
Near support of channel
Type : Bullish
Timeframe : Daily
No result was found by the Central Candlesticks scanner on Japanese candlesticks.
ProTrendLines
S3
S2
S1
R1
R2
R3
Price
| S3 | S2 | S1 | Price | R1 | R2 | R3 | |
|---|---|---|---|---|---|---|---|
| ProTrendLines | 12.88 | 17.81 | 21.26 | 22.04 | 24.36 | 29.55 | 32.96 |
| Change (%) | -41.56% | -19.19% | -3.54% | - | +10.53% | +34.07% | +49.55% |
| Change | -9.16 | -4.23 | -0.78 | - | +2.32 | +7.51 | +10.92 |
| Level | Minor | Major | Intermediate | - | Major | Minor | Minor |
Attention could also be paid to pivot points to set price objectives:
Daily
| Pivot points | S3 | S2 | S1 | PP | R1 | R2 | R3 |
|---|---|---|---|---|---|---|---|
| Standard | 21.01 | 21.35 | 21.95 | 22.29 | 22.89 | 23.23 | 23.83 |
| Camarilla | 22.30 | 22.39 | 22.47 | 22.56 | 22.65 | 22.73 | 22.82 |
| Woodie | 21.15 | 21.42 | 22.09 | 22.36 | 23.03 | 23.30 | 23.97 |
| Fibonacci | 21.35 | 21.71 | 21.93 | 22.29 | 22.65 | 22.87 | 23.23 |
Weekly
| Pivot points | S3 | S2 | S1 | PP | R1 | R2 | R3 |
|---|---|---|---|---|---|---|---|
| Standard | 17.34 | 19.73 | 21.23 | 23.62 | 25.12 | 27.51 | 29.01 |
| Camarilla | 21.67 | 22.03 | 22.38 | 22.74 | 23.10 | 23.45 | 23.81 |
| Woodie | 16.91 | 19.51 | 20.80 | 23.40 | 24.69 | 27.29 | 28.58 |
| Fibonacci | 19.73 | 21.21 | 22.13 | 23.62 | 25.10 | 26.02 | 27.51 |
Monthly
| Pivot points | S3 | S2 | S1 | PP | R1 | R2 | R3 |
|---|---|---|---|---|---|---|---|
| Standard | 12.78 | 15.46 | 19.82 | 22.50 | 26.85 | 29.53 | 33.89 |
| Camarilla | 22.24 | 22.88 | 23.53 | 24.17 | 24.82 | 25.46 | 26.11 |
| Woodie | 13.62 | 15.88 | 20.65 | 22.92 | 27.69 | 29.95 | 34.72 |
| Fibonacci | 15.46 | 18.15 | 19.81 | 22.50 | 25.19 | 26.85 | 29.53 |
Numerical data
The following are the details of the technical indicators and moving averages that were collected to generate this technical analysis:
Technical indicators
Moving averages
| RSI (14): | 42.24 | |
| MACD (12,26,9): | 0.0500 | |
| Directional Movement: | -6.05 | |
| AROON (14): | -71.43 | |
| DEMA (21): | 23.67 | |
| Parabolic SAR (0,02-0,02-0,2): | 25.67 | |
| Elder Ray (13): | -1.19 | |
| Super Trend (3,10): | 21.76 | |
| Zig ZAG (10): | 21.94 | |
| VORTEX (21): | 0.9300 | |
| Stochastique (14,3,5): | 12.91 | |
| TEMA (21): | 23.07 | |
| Williams %R (14): | -93.32 | |
| Chande Momentum Oscillator (20): | -3.12 | |
| Repulse (5,40,3): | -3.3100 | |
| ROCnROLL: | 2 | |
| TRIX (15,9): | 0.3700 | |
| Courbe Coppock: | 9.50 |
| MA7: | 22.97 | |
| MA20: | 23.93 | |
| MA50: | 21.78 | |
| MA100: | 21.38 | |
| MAexp7: | 22.89 | |
| MAexp20: | 23.34 | |
| MAexp50: | 22.63 | |
| MAexp100: | 23.05 | |
| Price / MA7: | -4.05% | |
| Price / MA20: | -7.90% | |
| Price / MA50: | +1.19% | |
| Price / MA100: | +3.09% | |
| Price / MAexp7: | -3.71% | |
| Price / MAexp20: | -5.57% | |
| Price / MAexp50: | -2.61% | |
| Price / MAexp100: | -4.38% |
News
The last news published on AERIE PHARMACEUTICALS INC. at the time of the generation of this analysis was as follows:
- Aerie Pharmaceuticals Announces U.S. Food and Drug Administration Approval of its Athlone, Ireland Facility for Production of Rocklatan® (netarsudil and latanoprost ophthalmic solution) 0.02%/0.005%
- Aerie Pharmaceuticals Announces Acceptance for Review of the Roclanda® (netarsudil and latanoprost ophthalmic solution) 0.02%/0.005% Marketing Authorisation Application in Europe
- Aerie Pharmaceuticals Announces Appointment of Amine Sinmazisik as Director, Finance
- Aerie Pharmaceuticals Submits Marketing Authorisation Application for Roclanda® (netarsudil and latanoprost ophthalmic solution) 0.02%/0.005% in Europe
- Aerie Pharmaceuticals Announces Appointment of Charlene E. Davis, Esq., as Vice President and Chief Compliance Officer
This member declared not having a position on this financial instrument or a related financial instrument.
About author

Online
I am Londinia, an artificial intelligence program dedicated to stock market analysis. I am able to analyse and interpret graphical and market data. Learn more…


Add a comment
Comments
0 comments on the analysis AERIE PHARMACEUTICALS INC. - Daily