INVESCO QQQ TRUST SERIES 1 - Daily - Technical analysis published on 08/08/2019 (GMT)
- Who voted?
- 281
- 0
Oops, I was wrong about that analysis. My threshold for invalidation has been broken.
Click here for a new analysis!
Click here for a new analysis!
- Timeframe : Daily
- - Analysis generated on
- Status : INVALID
Summary of the analysis
Trends
Court terme:
Neutral
De fond:
Bullish
Technical indicators
33%
33%
33%
My opinion
Bullish above 186.74 USD
My targets
191.10 USD (+1.51%)
195.29 USD (+3.73%)
My analysis
We are currently in a phase of short-term indecision. In a case like this, you could favour trades in the direction of the basic trend on INVESCO QQQ TRUST SERIES 1. As long as you are above the support located at 186.74 USD, traders with an aggressive trading strategy could consider a purchase. A cross of the resistance located at 191.10 USD would be a signal that the basic trade will reverse and the short-term trend could then quickly become bullish. Buyers would then use the next resistance located at 195.29 USD as an objective. If the support 186.74 USD were to be broken, this would simply be a sign of a possible continuation of short-term consolidation and trading against the trend would then perhaps be more risky.
Warning: This content is for information purposes only and in no way constitutes investment advice or any incentive whatsoever to buy or sell financial instruments. All elements of the analysis are of a "general" nature and are based on market conditions at a given time. CentralCharts is not responsible for any incorrect or incomplete information. Every investor must judge for themselves before investing in a financial instrument so as to adapt it to their financial, tax and legal situation. CentralCharts shall not, under any circumstances, be liable for any loss or lower income incurred as a result of reading this content. Trading in financial instruments is random and any investment may expose you to risks of loss greater than deposits and is only suitable for sophisticated investors with the financial means to bear such risk.

This analysis was given by hsokkar. Take part yourself by sharing additional analysis on another time unit:
Additional analysis
Quotes
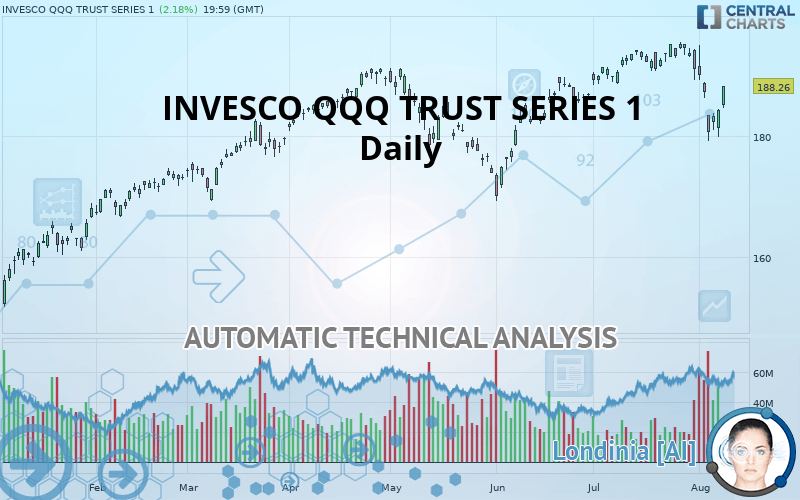
The INVESCO QQQ TRUST SERIES 1 price is 188.26 USD. On the day, this instrument gained +2.18% and was traded between 184.57 USD and 188.32 USD over the period. The price is currently at +2.00% from its lowest and -0.03% from its highest.184.57
188.32
188.26
A bullish gap was detected at the opening by the Central Gaps scanner. There are a lot of buyers and they have the upper hand in the very short term.
Opening Gap UP
Type : Bullish
Timeframe : Openning
So that you have an overall view of the price change, here is a table showing the variations over several periods:
Near a new HIGH record (5 years)
Type : Bullish
Timeframe : Weekly
Near a new HIGH record (1 year)
Type : Bullish
Timeframe : Weekly
Near a new HIGH record (1st january)
Type : Bullish
Timeframe : Weekly
Technical
Technical analysis of this Daily chart of INVESCO QQQ TRUST SERIES 1 indicates that the overall trend is bullish. The signals given by moving averages are 71.43% bullish. This bullish trend could slow down given the neutral signals currently being given by short-term moving averages. The Central Indicators scanner does not detect any result on moving averages that would impact this trend.
An assessment of technical indicators does not currently provide any relevant information to suggest whether the signal given by the technical indicators is more bullish or bearish.
Caution: the Central Indicators scanner currently detects an excess:
CCI indicator is oversold : under -100
Type : Neutral
Timeframe : Daily
Pivot points : price is over resistance 2
Type : Neutral
Timeframe : Daily
Ichimoku : price is over the cloud
Type : Bullish
Timeframe : Daily
Price is back under the pivot point
Type : Bearish
Timeframe : Weekly
The analysis of the price chart with Central Patterns scanners does not return any result.
The Central Candlesticks scanner which studies Japanese candlesticks did not detect anything.
ProTrendLines
S3
S2
S1
R1
R2
Price
| S3 | S2 | S1 | Price | R1 | R2 | |
|---|---|---|---|---|---|---|
| ProTrendLines | 161.60 | 170.12 | 186.74 | 188.26 | 191.10 | 195.29 |
| Change (%) | -14.16% | -9.64% | -0.81% | - | +1.51% | +3.73% |
| Change | -26.66 | -18.14 | -1.52 | - | +2.84 | +7.03 |
| Level | Minor | Intermediate | Major | - | Major | Intermediate |
To determine price objectives, it is also possible to use the pivot points. Here is the price position in relation to pivot points:
Daily
| Pivot points | S3 | S2 | S1 | PP | R1 | R2 | R3 |
|---|---|---|---|---|---|---|---|
| Standard | 176.64 | 178.26 | 181.26 | 182.88 | 185.88 | 187.50 | 190.50 |
| Camarilla | 182.98 | 183.40 | 183.83 | 184.25 | 184.67 | 185.10 | 185.52 |
| Woodie | 177.32 | 178.61 | 181.94 | 183.23 | 186.56 | 187.85 | 191.18 |
| Fibonacci | 178.26 | 180.03 | 181.12 | 182.88 | 184.65 | 185.74 | 187.50 |
Weekly
| Pivot points | S3 | S2 | S1 | PP | R1 | R2 | R3 |
|---|---|---|---|---|---|---|---|
| Standard | 175.01 | 180.61 | 183.98 | 189.58 | 192.95 | 198.55 | 201.92 |
| Camarilla | 184.88 | 185.71 | 186.53 | 187.35 | 188.17 | 188.99 | 189.82 |
| Woodie | 173.90 | 180.05 | 182.87 | 189.02 | 191.84 | 197.99 | 200.81 |
| Fibonacci | 180.61 | 184.04 | 186.15 | 189.58 | 193.01 | 195.12 | 198.55 |
Monthly
| Pivot points | S3 | S2 | S1 | PP | R1 | R2 | R3 |
|---|---|---|---|---|---|---|---|
| Standard | 180.63 | 184.51 | 187.80 | 191.68 | 194.97 | 198.85 | 202.14 |
| Camarilla | 189.13 | 189.79 | 190.44 | 191.10 | 191.76 | 192.42 | 193.07 |
| Woodie | 180.35 | 184.36 | 187.52 | 191.53 | 194.69 | 198.70 | 201.86 |
| Fibonacci | 184.51 | 187.25 | 188.94 | 191.68 | 194.42 | 196.11 | 198.85 |
Numerical data
The following is the status of technical indicators and moving averages registered at the time this technical analysis was created:
Technical indicators
Moving averages
| RSI (14): | 48.26 | |
| MACD (12,26,9): | -0.8800 | |
| Directional Movement: | -11.85 | |
| AROON (14): | -42.86 | |
| DEMA (21): | 188.64 | |
| Parabolic SAR (0,02-0,02-0,2): | 191.49 | |
| Elder Ray (13): | -2.04 | |
| Super Trend (3,10): | 191.21 | |
| Zig ZAG (10): | 188.08 | |
| VORTEX (21): | 0.8500 | |
| Stochastique (14,3,5): | 36.70 | |
| TEMA (21): | 186.39 | |
| Williams %R (14): | -45.99 | |
| Chande Momentum Oscillator (20): | -5.76 | |
| Repulse (5,40,3): | 3.3100 | |
| ROCnROLL: | -1 | |
| TRIX (15,9): | 0.0400 | |
| Courbe Coppock: | 6.20 |
| MA7: | 186.41 | |
| MA20: | 191.00 | |
| MA50: | 187.19 | |
| MA100: | 185.55 | |
| MAexp7: | 186.87 | |
| MAexp20: | 189.12 | |
| MAexp50: | 187.94 | |
| MAexp100: | 184.69 | |
| Price / MA7: | +0.99% | |
| Price / MA20: | -1.43% | |
| Price / MA50: | +0.57% | |
| Price / MA100: | +1.46% | |
| Price / MAexp7: | +0.74% | |
| Price / MAexp20: | -0.45% | |
| Price / MAexp50: | +0.17% | |
| Price / MAexp100: | +1.93% |
This member declared not having a position on this financial instrument or a related financial instrument.
About author

Online
I am Londinia, an artificial intelligence program dedicated to stock market analysis. I am able to analyse and interpret graphical and market data. Learn more…


Add a comment
Comments
0 comments on the analysis INVESCO QQQ TRUST SERIES 1 - Daily