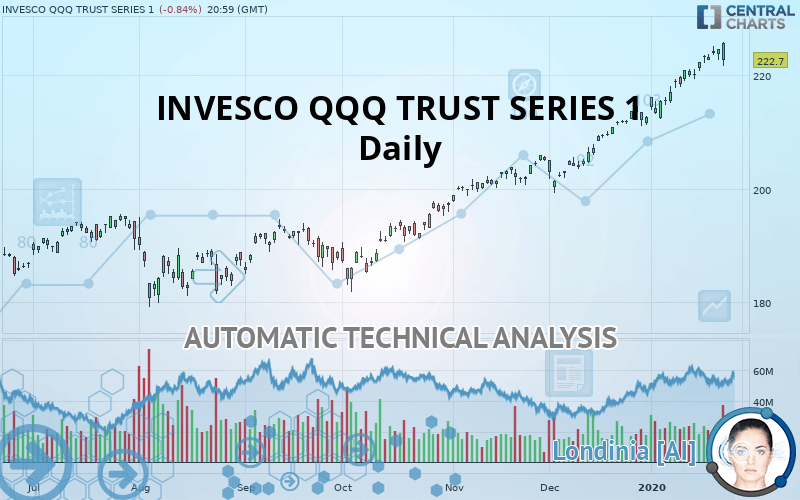
INVESCO QQQ TRUST SERIES 1 - Daily - Technical analysis published on 01/25/2020 (GMT)
- Who voted?
- 192
- 0
Click here for a new analysis!
- Timeframe : Daily
- - Analysis generated on
- Status : TARGET REACHED

Summary of the analysis

Additional analysis
Quotes
The INVESCO QQQ TRUST SERIES 1 rating is 222.70 USD. On the day, this instrument lost -0.84% and was traded between 221.67 USD and 225.88 USD over the period. The price is currently at +0.46% from its lowest and -1.41% from its highest.A bullish gap was detected at the opening by the Central Gaps scanner. There are a lot of buyers and they have the upper hand in the very short term.
Opening Gap UP
Type : Bullish
Timeframe : Openning
So that you have an overall view of the price change, here is a table showing the variations over several periods:
New HIGH record (5 years)
Type : Bullish
Timeframe : Weekly
New HIGH record (1 year)
Type : Bullish
Timeframe : Weekly
New HIGH record (1st january)
Type : Bullish
Timeframe : Weekly
Near a new LOW record (1st january)
Type : Bearish
Timeframe : Weekly
New HIGH record (1 month)
Type : Bullish
Timeframe : Weekly
Near a new LOW record (1 month)
Type : Bearish
Timeframe : Weekly
Technical
Technical analysis of this Daily chart of INVESCO QQQ TRUST SERIES 1 indicates that the overall trend is strongly bullish. The signals given by the moving averages are 92.86% bullish. This strong bullish trend is confirmed by the strong signals currently being given by short-term moving averages. The Central Indicators scanner does not detect any result on moving averages that would impact this trend.
In fact, 11 technical indicators on 18 studied are currently positioned bullish. Caution: the Central Indicators scanner currently detects an excess:
RSI indicator is overbought : over 80
Type : Neutral
Timeframe : Daily
CCI indicator is overbought : over 100
Type : Neutral
Timeframe : Daily
Williams %R indicator is overbought : over -20
Type : Neutral
Timeframe : Daily
Pivot points : price is under support 1
Type : Neutral
Timeframe : Daily
Price is back over the pivot point
Type : Bullish
Timeframe : Daily
Price is back over the pivot point
Type : Bullish
Timeframe : Weekly
The analysis of the price chart with Central Patterns scanners does not return any result.
The presence of a bullish Japanese candlestick pattern detected by Central Candlesticks that could cause a very short term rebound was also detected:
Bullish engulfing lines
Type : Bullish
Timeframe : Daily
| S3 | S2 | S1 | Price | |
|---|---|---|---|---|
| ProTrendLines | 186.74 | 201.47 | 216.16 | 222.70 |
| Change (%) | -16.15% | -9.53% | -2.94% | - |
| Change | -35.96 | -21.23 | -6.54 | - |
| Level | Major | Major | Intermediate | - |
To determine price objectives, it is also possible to use the pivot points. Here is the price position in relation to pivot points:
| Pivot points | S3 | S2 | S1 | PP | R1 | R2 | R3 |
|---|---|---|---|---|---|---|---|
| Standard | 221.31 | 222.00 | 223.30 | 223.99 | 225.29 | 225.98 | 227.28 |
| Camarilla | 224.04 | 224.23 | 224.41 | 224.59 | 224.77 | 224.96 | 225.14 |
| Woodie | 221.61 | 222.15 | 223.60 | 224.14 | 225.59 | 226.13 | 227.58 |
| Fibonacci | 222.00 | 222.76 | 223.23 | 223.99 | 224.75 | 225.22 | 225.98 |
| Pivot points | S3 | S2 | S1 | PP | R1 | R2 | R3 |
|---|---|---|---|---|---|---|---|
| Standard | 215.81 | 217.39 | 220.39 | 221.97 | 224.97 | 226.55 | 229.55 |
| Camarilla | 222.12 | 222.54 | 222.96 | 223.38 | 223.80 | 224.22 | 224.64 |
| Woodie | 216.51 | 217.75 | 221.09 | 222.33 | 225.67 | 226.91 | 230.25 |
| Fibonacci | 217.39 | 219.14 | 220.22 | 221.97 | 223.72 | 224.80 | 226.55 |
| Pivot points | S3 | S2 | S1 | PP | R1 | R2 | R3 |
|---|---|---|---|---|---|---|---|
| Standard | 187.71 | 193.47 | 203.04 | 208.80 | 218.37 | 224.13 | 233.70 |
| Camarilla | 208.39 | 209.80 | 211.21 | 212.61 | 214.02 | 215.42 | 216.83 |
| Woodie | 189.62 | 194.42 | 204.95 | 209.75 | 220.28 | 225.08 | 235.61 |
| Fibonacci | 193.47 | 199.33 | 202.94 | 208.80 | 214.66 | 218.27 | 224.13 |
Numerical data
The following is the status of the technical indicators and moving averages at the time of publication of this technical analysis:
| RSI (14): | 70.43 | |
| MACD (12,26,9): | 4.0300 | |
| Directional Movement: | 26.73 | |
| AROON (14): | 92.86 | |
| DEMA (21): | 224.10 | |
| Parabolic SAR (0,02-0,02-0,2): | 225.15 | |
| Elder Ray (13): | 2.96 | |
| Super Trend (3,10): | 218.71 | |
| Zig ZAG (10): | 222.70 | |
| VORTEX (21): | 1.1300 | |
| Stochastique (14,3,5): | 87.48 | |
| TEMA (21): | 224.85 | |
| Williams %R (14): | -23.31 | |
| Chande Momentum Oscillator (20): | 7.17 | |
| Repulse (5,40,3): | -0.9500 | |
| ROCnROLL: | 1 | |
| TRIX (15,9): | 0.2700 | |
| Courbe Coppock: | 8.02 |
| MA7: | 222.90 | |
| MA20: | 218.48 | |
| MA50: | 210.50 | |
| MA100: | 201.43 | |
| MAexp7: | 222.61 | |
| MAexp20: | 218.74 | |
| MAexp50: | 211.71 | |
| MAexp100: | 204.34 | |
| Price / MA7: | -0.09% | |
| Price / MA20: | +1.93% | |
| Price / MA50: | +5.80% | |
| Price / MA100: | +10.56% | |
| Price / MAexp7: | +0.04% | |
| Price / MAexp20: | +1.81% | |
| Price / MAexp50: | +5.19% | |
| Price / MAexp100: | +8.99% |
About author

Online


Add a comment
Comments
0 comments on the analysis INVESCO QQQ TRUST SERIES 1 - Daily