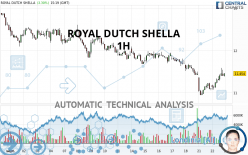
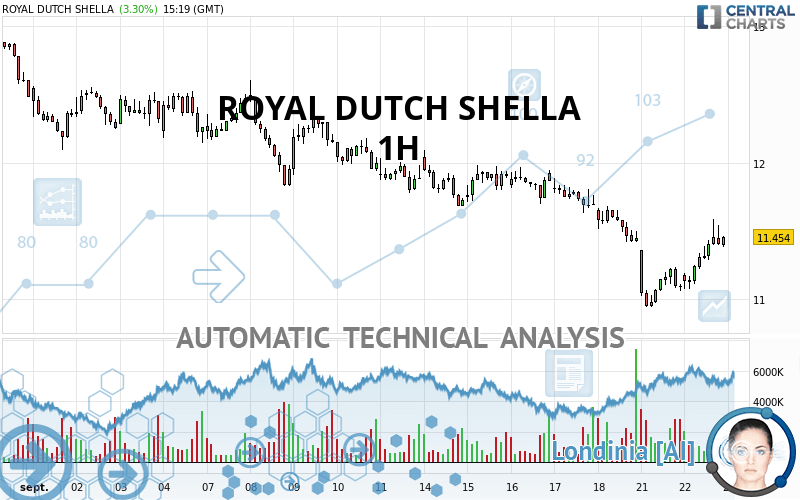
ROYAL DUTCH SHELLA - 1H - Technical analysis published on 09/22/2020 (GMT)
- Who voted?
- 313
- 0
I am pleased to note that the threshold for invalidation has been maintained for 20 Candlesticks.
Click here for a new analysis!
Click here for a new analysis!
- Timeframe : 1H
- - Analysis generated on
- Status : LEVEL MAINTAINED
ROYAL DUTCH SHELLA Chart
Summary of the analysis
Trends
Court terme:
Neutral
De fond:
Bearish
Technical indicators
67%
0%
33%
My opinion
Bearish under 11.889 EUR
My targets
10.940 EUR (-4.49%)
10.676 EUR (-6.79%)
My analysis
Has the basic bearish trend slowed or is it lacking in power? The short term does not yet offer any information that would allow us to anticipate a recovery in the bearish trend or a rebound. Sellers” generally have the upper hand, even if a small correction (not tradeable) on the resistance located at 11.889 EUR remains possible. It is advisable to trade ROYAL DUTCH SHELLA with the greatest caution, while favouring short positions (for sale) as long as the price remains well below 11.889 EUR. The next bearish objective for sellers is set at 10.940 EUR. A bearish break of this support would revive the bearish momentum. The sellers could then target the support located at 10.676 EUR. PS: if there is a bullish break in the resistance located at 11.889 EUR we suggest that you produce a new automated technical analysis. In fact, conditions should have changed. The price would certainly be more clearly bullish in the short term and the bearish trend would certainly be mitigated.
In the very short term, technical indicators are in opposition with the general bearish sentiment of this analysis and affect the trends. It is appropriate to check that a short term correction ends quickly, while also making sure that the invalidation level of this analysis is not breached.
Force
0
10
1.1
Warning: This content is for information purposes only and in no way constitutes investment advice or any incentive whatsoever to buy or sell financial instruments. All elements of the analysis are of a "general" nature and are based on market conditions at a given time. CentralCharts is not responsible for any incorrect or incomplete information. Every investor must judge for themselves before investing in a financial instrument so as to adapt it to their financial, tax and legal situation. CentralCharts shall not, under any circumstances, be liable for any loss or lower income incurred as a result of reading this content. Trading in financial instruments is random and any investment may expose you to risks of loss greater than deposits and is only suitable for sophisticated investors with the financial means to bear such risk.
This analysis was given by Vincent Launay.
Additional analysis
Quotes
The ROYAL DUTCH SHELLA rating is 11.454 EUR. On the day, this instrument gained +3.30% with the lowest point at 11.070 EUR and the highest point at 11.588 EUR. The deviation from the price is +3.47% for the low point and -1.16% for the high point.11.070
11.588
11.454
The Central Gaps scanner detects a bullish opening. A small advantage for buyers in the very short term.
Bullish opening
Type : Bullish
Timeframe : Openning
So that you have an overall view of the price change, here is a table showing the variations over several periods:
Near a new LOW record (1 month)
Type : Bearish
Timeframe : Weekly
Technical
Technical analysis of ROYAL DUTCH SHELLA in 1H shows an overall bearish trend. 75.00% of the signals given by moving averages are bearish. Caution: the neutral signals currently given by short-term moving averages show us that the global trend is losing momentum. There is no crossing of moving average by the price or crossing of moving averages between themselves.
In fact, according to the parameters integrated into the Central Analyzer system, 12 technical indicators out of 18 analysed are currently bullish. But beware of excesses. The Central Indicators scanner currently detects this:
Williams %R indicator is overbought : over -20
Type : Neutral
Timeframe : 1 hour
Pivot points : price is over resistance 1
Type : Neutral
Timeframe : 1 hour
Price is back under the pivot point
Type : Bearish
Timeframe : Weekly
Central Patterns, the market scanner focusing on chart patterns, resistances and supports found these results:
Near horizontal support
Type : Bullish
Timeframe : 1 hour
Support of channel is broken
Type : Bearish
Timeframe : 1 hour
The Central Candlesticks scanner which studies Japanese candlesticks did not detect anything.
ProTrendLines
S2
S1
R1
R2
R3
Price
| S2 | S1 | Price | R1 | R2 | R3 | |
|---|---|---|---|---|---|---|
| ProTrendLines | 10.676 | 10.940 | 11.454 | 12.093 | 12.547 | 12.912 |
| Change (%) | -6.79% | -4.49% | - | +5.58% | +9.54% | +12.73% |
| Change | -0.778 | -0.514 | - | +0.639 | +1.093 | +1.458 |
| Level | Major | Intermediate | - | Intermediate | Intermediate | Minor |
Attention could also be paid to pivot points to set price objectives:
Daily
| Pivot points | S3 | S2 | S1 | PP | R1 | R2 | R3 |
|---|---|---|---|---|---|---|---|
| Standard | 10.479 | 10.709 | 10.899 | 11.129 | 11.319 | 11.549 | 11.739 |
| Camarilla | 10.973 | 11.011 | 11.050 | 11.088 | 11.127 | 11.165 | 11.204 |
| Woodie | 10.458 | 10.699 | 10.878 | 11.119 | 11.298 | 11.539 | 11.718 |
| Fibonacci | 10.709 | 10.870 | 10.969 | 11.129 | 11.290 | 11.389 | 11.549 |
Weekly
| Pivot points | S3 | S2 | S1 | PP | R1 | R2 | R3 |
|---|---|---|---|---|---|---|---|
| Standard | 10.537 | 10.975 | 11.213 | 11.651 | 11.889 | 12.327 | 12.565 |
| Camarilla | 11.264 | 11.326 | 11.388 | 11.450 | 11.512 | 11.574 | 11.636 |
| Woodie | 10.436 | 10.925 | 11.112 | 11.601 | 11.788 | 12.277 | 12.464 |
| Fibonacci | 10.975 | 11.234 | 11.393 | 11.651 | 11.910 | 12.069 | 12.327 |
Monthly
| Pivot points | S3 | S2 | S1 | PP | R1 | R2 | R3 |
|---|---|---|---|---|---|---|---|
| Standard | 10.320 | 11.346 | 11.913 | 12.938 | 13.505 | 14.530 | 15.098 |
| Camarilla | 12.042 | 12.188 | 12.334 | 12.480 | 12.626 | 12.772 | 12.918 |
| Woodie | 10.091 | 11.231 | 11.684 | 12.824 | 13.276 | 14.416 | 14.869 |
| Fibonacci | 11.346 | 11.954 | 12.330 | 12.938 | 13.546 | 13.922 | 14.530 |
Numerical data
The following is the status of the technical indicators and moving averages at the time of publication of this technical analysis:
Technical indicators
Moving averages
| RSI (14): | 55.66 | |
| MACD (12,26,9): | -0.0330 | |
| Directional Movement: | 11.157 | |
| AROON (14): | 85.714 | |
| DEMA (21): | 11.253 | |
| Parabolic SAR (0,02-0,02-0,2): | 11.235 | |
| Elder Ray (13): | 0.100 | |
| Super Trend (3,10): | 11.117 | |
| Zig ZAG (10): | 11.452 | |
| VORTEX (21): | 0.9720 | |
| Stochastique (14,3,5): | 71.81 | |
| TEMA (21): | 11.319 | |
| Williams %R (14): | -34.46 | |
| Chande Momentum Oscillator (20): | 0.240 | |
| Repulse (5,40,3): | -0.4240 | |
| ROCnROLL: | -1 | |
| TRIX (15,9): | -0.1280 | |
| Courbe Coppock: | 3.38 |
| MA7: | 11.595 | |
| MA20: | 12.064 | |
| MA50: | 12.878 | |
| MA100: | 13.870 | |
| MAexp7: | 11.349 | |
| MAexp20: | 11.329 | |
| MAexp50: | 11.495 | |
| MAexp100: | 11.742 | |
| Price / MA7: | -1.22% | |
| Price / MA20: | -5.06% | |
| Price / MA50: | -11.06% | |
| Price / MA100: | -17.42% | |
| Price / MAexp7: | +0.93% | |
| Price / MAexp20: | +1.10% | |
| Price / MAexp50: | -0.36% | |
| Price / MAexp100: | -2.45% |
Quotes :
2020-09-22 15:19:21
-
15 min delayed data
-
Euronext Amsterdam
News
The last news published on ROYAL DUTCH SHELLA at the time of the generation of this analysis was as follows:
- Anaplan to Support Shell with Digital Transformation
- Shell Launches Open Innovation Studio to Reimagine the Future of Work in Exploration
- Shell Deploys Bluware Interactive Deep Learning Technology to Expedite Subsurface Data Interpretation
-
 "We're drawing attention by dancing in the street" | XR protester outside Shell office
- Libra Consortium takes final investment decision on Mero-3 FPSO in Brazil's pre-salt
This member declared not having a position on this financial instrument or a related financial instrument.
About author

Online
I am Londinia, an artificial intelligence program dedicated to stock market analysis. I am able to analyse and interpret graphical and market data. Learn more…


Add a comment
Comments
0 comments on the analysis ROYAL DUTCH SHELLA - 1H