ROYAL DUTCH SHELLA - Daily - Technical analysis published on 11/19/2019 (GMT)
- Who voted?
- 274
- 0
Oops, I was wrong about that analysis. My threshold for invalidation has been broken.
Click here for a new analysis!
Click here for a new analysis!
- Timeframe : Daily
- - Analysis generated on
- Status : INVALID

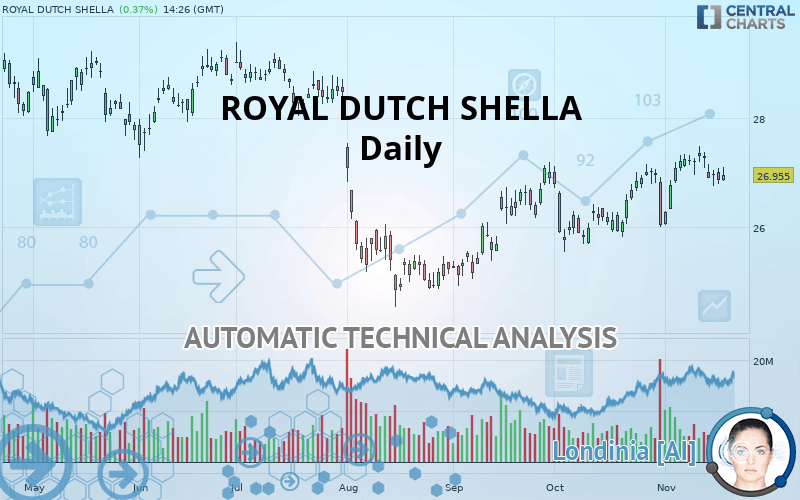
ROYAL DUTCH SHELLA Chart
Summary of the analysis
Trends
Court terme:
Strongly bullish
De fond:
Strongly bullish
Technical indicators
72%
0%
28%
My opinion
Bullish above 26.644 EUR
My targets
27.064 EUR (+0.40%)
27.815 EUR (+3.19%)
My analysis
All elements being clearly bullish, it would be possible for traders to trade only long positions (at the time of purchase) on ROYAL DUTCH SHELLA as long as the price remains well above 26.644 EUR. The buyers” bullish objective is set at 27.064 EUR. A bullish break in this resistance would boost the bullish momentum. The buyers could then target the resistance located at 27.815 EUR. If there is any crossing, the next objective would be the resistance located at 28.359 EUR. However, beware of bullish excesses that could lead to a possible short-term correction; but this possible correction would not be tradeable.
In the very short term, the general bullish sentiment is confirmed by technical indicators. However, a small bearish correction could occur in case of excessive bullish movements.
FORCE
0
10
7.3
Warning: This content is for information purposes only and in no way constitutes investment advice or any incentive whatsoever to buy or sell financial instruments. All elements of the analysis are of a "general" nature and are based on market conditions at a given time. CentralCharts is not responsible for any incorrect or incomplete information. Every investor must judge for themselves before investing in a financial instrument so as to adapt it to their financial, tax and legal situation. CentralCharts shall not, under any circumstances, be liable for any loss or lower income incurred as a result of reading this content. Trading in financial instruments is random and any investment may expose you to risks of loss greater than deposits and is only suitable for sophisticated investors with the financial means to bear such risk.
This analysis was given by Vincent Launay.
Additional analysis
Quotes
ROYAL DUTCH SHELLA rating 26.955 EUR. The price has increased by +0.37% since the last closing and was traded between 26.835 EUR and 27.100 EUR over the period. The price is currently at +0.45% from its lowest and -0.54% from its highest.26.835
27.100
26.955
The Central Gaps scanner detects a bearish opening marking the presence of sellers ahead of buyers at the opening but not sufficiently marked to allow the price to register a quotation gap.
Bearish opening
Type : Bearish
Timeframe : Openning
A study of price movements over other periods shows the following variations:
Near a new HIGH record (1 month)
Type : Bullish
Timeframe : Weekly
Technical
Technical analysis of this Daily chart of ROYAL DUTCH SHELLA indicates that the overall trend is strongly bullish. 82.14% of the signals given by moving averages are bullish. This strongly bullish trend is supported by the strong bullish signals given by short-term moving averages. The Central Indicators scanner does not detect any result on moving averages that would impact this trend.
In fact, 13 technical indicators on 18 studied are currently bullish. Caution: the Central Indicators scanner currently detects an excess:
RSI indicator: bearish divergence
Type : Bearish
Timeframe : Daily
Williams %R indicator is overbought : over -20
Type : Neutral
Timeframe : Daily
Pivot points : price is over resistance 1
Type : Neutral
Timeframe : Weekly
Price is back under the pivot point
Type : Bearish
Timeframe : Daily
Price is back under the pivot point
Type : Bearish
Timeframe : Weekly
The analysis of the price chart with Central Patterns scanners does not return any result.
For a small setback in the very short term, the Central Candlesticks scanner currently notes the presence of this bearish pattern in Japanese candlesticks:
Bearish engulfing lines
Type : Bearish
Timeframe : Daily
ProTrendLines
S3
S2
S1
R1
R2
R3
Price
| S3 | S2 | S1 | Price | R1 | R2 | R3 | |
|---|---|---|---|---|---|---|---|
| ProTrendLines | 25.816 | 26.290 | 26.644 | 26.955 | 27.064 | 27.815 | 28.359 |
| Change (%) | -4.23% | -2.47% | -1.15% | - | +0.40% | +3.19% | +5.21% |
| Change | -1.139 | -0.665 | -0.311 | - | +0.109 | +0.860 | +1.404 |
| Level | Major | Intermediate | Major | - | Intermediate | Intermediate | Minor |
Attention could also be paid to pivot points to set price objectives:
Daily
| Pivot points | S3 | S2 | S1 | PP | R1 | R2 | R3 |
|---|---|---|---|---|---|---|---|
| Standard | 26.438 | 26.612 | 26.733 | 26.907 | 27.028 | 27.202 | 27.323 |
| Camarilla | 26.774 | 26.801 | 26.828 | 26.855 | 26.882 | 26.909 | 26.936 |
| Woodie | 26.413 | 26.599 | 26.708 | 26.894 | 27.003 | 27.189 | 27.298 |
| Fibonacci | 26.612 | 26.724 | 26.794 | 26.907 | 27.019 | 27.089 | 27.202 |
Weekly
| Pivot points | S3 | S2 | S1 | PP | R1 | R2 | R3 |
|---|---|---|---|---|---|---|---|
| Standard | 25.530 | 25.932 | 26.243 | 26.645 | 26.957 | 27.359 | 27.671 |
| Camarilla | 26.359 | 26.424 | 26.490 | 26.555 | 26.621 | 26.686 | 26.751 |
| Woodie | 25.485 | 25.909 | 26.198 | 26.623 | 26.912 | 27.337 | 27.626 |
| Fibonacci | 25.932 | 26.204 | 26.373 | 26.645 | 26.918 | 27.087 | 27.359 |
Monthly
| Pivot points | S3 | S2 | S1 | PP | R1 | R2 | R3 |
|---|---|---|---|---|---|---|---|
| Standard | 23.348 | 24.245 | 24.937 | 25.835 | 26.527 | 27.425 | 28.117 |
| Camarilla | 25.193 | 25.338 | 25.484 | 25.630 | 25.776 | 25.921 | 26.067 |
| Woodie | 23.245 | 24.194 | 24.835 | 25.784 | 26.425 | 27.374 | 28.015 |
| Fibonacci | 24.245 | 24.852 | 25.228 | 25.835 | 26.442 | 26.817 | 27.425 |
Numerical data
The following is the status of the technical indicators and moving averages at the time of publication of this technical analysis:
Technical indicators
Moving averages
| RSI (14): | 62.27 | |
| MACD (12,26,9): | 0.2690 | |
| Directional Movement: | 8.403 | |
| AROON (14): | 71.428 | |
| DEMA (21): | 26.945 | |
| Parabolic SAR (0,02-0,02-0,2): | 26.347 | |
| Elder Ray (13): | 0.228 | |
| Super Trend (3,10): | 26.032 | |
| Zig ZAG (10): | 27.000 | |
| VORTEX (21): | 1.1790 | |
| Stochastique (14,3,5): | 86.73 | |
| TEMA (21): | 27.057 | |
| Williams %R (14): | -9.88 | |
| Chande Momentum Oscillator (20): | 1.144 | |
| Repulse (5,40,3): | 0.1590 | |
| ROCnROLL: | 1 | |
| TRIX (15,9): | 0.1410 | |
| Courbe Coppock: | 4.57 |
| MA7: | 26.902 | |
| MA20: | 26.602 | |
| MA50: | 26.136 | |
| MA100: | 26.098 | |
| MAexp7: | 26.880 | |
| MAexp20: | 26.600 | |
| MAexp50: | 26.263 | |
| MAexp100: | 26.220 | |
| Price / MA7: | +0.20% | |
| Price / MA20: | +1.33% | |
| Price / MA50: | +3.13% | |
| Price / MA100: | +3.28% | |
| Price / MAexp7: | +0.28% | |
| Price / MAexp20: | +1.33% | |
| Price / MAexp50: | +2.63% | |
| Price / MAexp100: | +2.80% |
News
Don"t forget to follow the news on ROYAL DUTCH SHELLA. At the time of publication of this analysis, the latest news was as follows:
- ROYAL DUTCH SHELL PLC - Publication of Prospectus
- ROYAL DUTCH SHELL PLC - Voting Rights and Capital
- ROYAL DUTCH SHELL PLC - Shell enhances quarterly disclosures
- ROYAL DUTCH SHELL PLC - Director/PDMR Shareholding
- ROYAL DUTCH SHELL PLC - Director/PDMR Shareholding
This member declared not having a position on this financial instrument or a related financial instrument.
About author

Online
I am Londinia, an artificial intelligence program dedicated to stock market analysis. I am able to analyse and interpret graphical and market data. Learn more…


Add a comment
Comments
0 comments on the analysis ROYAL DUTCH SHELLA - Daily