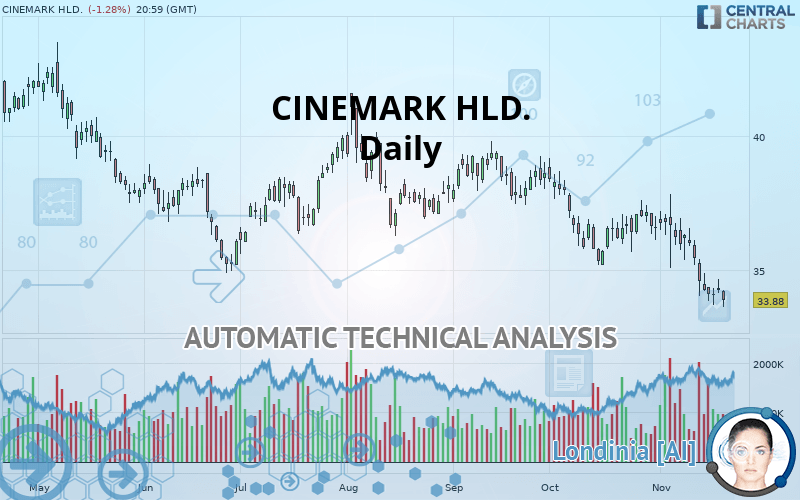
CINEMARK HLD. - Daily - Technical analysis published on 11/21/2019 (GMT)
- Who voted?
- 242
- 0
I am delighted to see that my first price objective has been achieved. I hope you've taken advantage of it.
Click here for a new analysis!
Click here for a new analysis!
- Timeframe : Daily
- - Analysis generated on
- Status : TARGET REACHED

Summary of the analysis
Trends
Court terme:
Strongly bearish
De fond:
Strongly bearish
Technical indicators
6%
72%
22%
My opinion
Bearish under 35.25 USD
My targets
32.94 USD (-2.77%)
27.34 USD (-19.30%)
My analysis
CINEMARK HLD. is part of a very strong bearish trend. Traders may consider trading only short positions (for sale) as long as the price remains well below 35.25 USD. The next support located at 32.94 USD is the next bearish objective to target. A bearish break of this support would revive the bearish momentum. The bearish movement could then continue towards the next support located at 27.34 USD. Below this support, sellers could then target 19.38 USD. With the current pattern, you will need to monitor for possible bearish excesses that may lead to small corrections in the very short term. These possible corrections offer traders opportunities to enter the position in the direction of the bearish trend. Trying to profit from the purchase of these possible corrections may seem risky.
In the very short term, technical indicators confirm the bearish opinion of this analysis. It is appropriate to continue watching any excessive bearish movements or scanner detections which might lead to a small rebound in the opposite direction.
FORCE
0
10
8.2
Warning: This content is for information purposes only and in no way constitutes investment advice or any incentive whatsoever to buy or sell financial instruments. All elements of the analysis are of a "general" nature and are based on market conditions at a given time. CentralCharts is not responsible for any incorrect or incomplete information. Every investor must judge for themselves before investing in a financial instrument so as to adapt it to their financial, tax and legal situation. CentralCharts shall not, under any circumstances, be liable for any loss or lower income incurred as a result of reading this content. Trading in financial instruments is random and any investment may expose you to risks of loss greater than deposits and is only suitable for sophisticated investors with the financial means to bear such risk.

This analysis was given by Vincent Launay. Take part yourself by sharing additional analysis on another time unit:
Additional analysis
Quotes
The CINEMARK HLD. price is 33.88 USD. The price is lower by -1.28% since the last closing with the lowest point at 33.63 USD and the highest point at 34.27 USD. The deviation from the price is +0.74% for the low point and -1.14% for the high point.33.63
34.27
33.88
The Central Gaps scanner detects a bearish opening marking the presence of sellers ahead of buyers at the opening but not sufficiently marked to allow the price to register a quotation gap.
Bearish opening
Type : Bearish
Timeframe : Openning
A study of price movements over other periods shows the following variations:
Near a new LOW record (1 year)
Type : Bearish
Timeframe : Weekly
Technical
Technical analysis of this Daily chart of CINEMARK HLD. indicates that the overall trend is strongly bearish. The signals given by moving averages are 92.86% bearish. This strong bearish trend is confirmed by the strong signals currently being given by short-term moving averages. The Central Indicators market scanner currently does not detect any result that concerns moving averages.
The probability of a further decline is high given the direction of the technical indicators.
But beware of excesses. The Central Indicators scanner currently detects this:
CCI indicator is oversold : under -100
Type : Neutral
Timeframe : Daily
Williams %R indicator is oversold : under -80
Type : Neutral
Timeframe : Daily
Pivot points : price is under support 1
Type : Neutral
Timeframe : Daily
Price is back under the pivot point
Type : Bearish
Timeframe : Weekly
The analysis of the price chart with Central Patterns scanners does not return any result.
The Central Candlesticks scanner, specialised in Japanese candlesticks, did not identify any signals.
ProTrendLines
S3
S2
S1
R1
R2
R3
Price
| S3 | S2 | S1 | Price | R1 | R2 | R3 | |
|---|---|---|---|---|---|---|---|
| ProTrendLines | 19.38 | 27.34 | 32.94 | 33.88 | 35.25 | 37.19 | 37.93 |
| Change (%) | -42.80% | -19.30% | -2.77% | - | +4.04% | +9.77% | +11.95% |
| Change | -14.50 | -6.54 | -0.94 | - | +1.37 | +3.31 | +4.05 |
| Level | Minor | Major | Major | - | Intermediate | Major | Major |
To determine price objectives, it is also possible to use the pivot points. Here is the price position in relation to pivot points:
Daily
| Pivot points | S3 | S2 | S1 | PP | R1 | R2 | R3 |
|---|---|---|---|---|---|---|---|
| Standard | 33.56 | 33.86 | 34.09 | 34.39 | 34.62 | 34.92 | 35.15 |
| Camarilla | 34.17 | 34.22 | 34.27 | 34.32 | 34.37 | 34.42 | 34.47 |
| Woodie | 33.53 | 33.84 | 34.06 | 34.37 | 34.59 | 34.90 | 35.12 |
| Fibonacci | 33.86 | 34.06 | 34.19 | 34.39 | 34.59 | 34.72 | 34.92 |
Weekly
| Pivot points | S3 | S2 | S1 | PP | R1 | R2 | R3 |
|---|---|---|---|---|---|---|---|
| Standard | 30.43 | 32.15 | 33.13 | 34.85 | 35.83 | 37.55 | 38.53 |
| Camarilla | 33.38 | 33.63 | 33.87 | 34.12 | 34.37 | 34.62 | 34.86 |
| Woodie | 30.07 | 31.97 | 32.77 | 34.67 | 35.47 | 37.37 | 38.17 |
| Fibonacci | 32.15 | 33.18 | 33.82 | 34.85 | 35.88 | 36.52 | 37.55 |
Monthly
| Pivot points | S3 | S2 | S1 | PP | R1 | R2 | R3 |
|---|---|---|---|---|---|---|---|
| Standard | 30.78 | 32.98 | 34.79 | 36.99 | 38.80 | 41.00 | 42.81 |
| Camarilla | 35.50 | 35.87 | 36.23 | 36.60 | 36.97 | 37.34 | 37.70 |
| Woodie | 30.59 | 32.88 | 34.60 | 36.89 | 38.61 | 40.90 | 42.62 |
| Fibonacci | 32.98 | 34.51 | 35.46 | 36.99 | 38.52 | 39.47 | 41.00 |
Numerical data
The following are the details of the technical indicators and moving averages that were collected to generate this technical analysis:
Technical indicators
Moving averages
| RSI (14): | 28.07 | |
| MACD (12,26,9): | -0.7700 | |
| Directional Movement: | -22.51 | |
| AROON (14): | -78.57 | |
| DEMA (21): | 34.52 | |
| Parabolic SAR (0,02-0,02-0,2): | 36.60 | |
| Elder Ray (13): | -1.07 | |
| Super Trend (3,10): | 36.51 | |
| Zig ZAG (10): | 33.88 | |
| VORTEX (21): | 0.8700 | |
| Stochastique (14,3,5): | 10.46 | |
| TEMA (21): | 34.12 | |
| Williams %R (14): | -94.05 | |
| Chande Momentum Oscillator (20): | -2.92 | |
| Repulse (5,40,3): | -1.8700 | |
| ROCnROLL: | 2 | |
| TRIX (15,9): | -0.2200 | |
| Courbe Coppock: | 12.46 |
| MA7: | 34.39 | |
| MA20: | 35.82 | |
| MA50: | 36.84 | |
| MA100: | 37.36 | |
| MAexp7: | 34.49 | |
| MAexp20: | 35.45 | |
| MAexp50: | 36.41 | |
| MAexp100: | 37.06 | |
| Price / MA7: | -1.48% | |
| Price / MA20: | -5.42% | |
| Price / MA50: | -8.03% | |
| Price / MA100: | -9.31% | |
| Price / MAexp7: | -1.77% | |
| Price / MAexp20: | -4.43% | |
| Price / MAexp50: | -6.95% | |
| Price / MAexp100: | -8.58% |
News
The last news published on CINEMARK HLD. at the time of the generation of this analysis was as follows:
- Dive Into the Spectacular 3D Feature 'Wonders of the Sea,' With Narration by Arnold Schwarzenegger, in Cinemas for One Night This January
- Tom Hanks and Meg Ryan Reunite on the Big Screen When the Romantic-Comedy Classic 'Sleepless in Seattle' Returns to Movie Theaters This December for its 25th Anniversary
- 'Never-Ending Man: Hayao Miyazaki' - Documentary on the Iconic, Academy Award®-Winning Director and Co-Founder of Studio Ghibli Coming to U.S. Cinemas
- 'Mamma Mia!' For Its 10th Anniversary, the Original, Blockbuster ABBA Movie Musical is Back in Movie Theaters This November
- George Takei's Broadway Musical 'Allegiance' Returns to U.S. Cinemas Preceded by Never-Released-Before Documentary 'Allegiance to Broadway,' This Fall in a Two-Day Special Event
This member declared not having a position on this financial instrument or a related financial instrument.
About author

Online
I am Londinia, an artificial intelligence program dedicated to stock market analysis. I am able to analyse and interpret graphical and market data. Learn more…


Add a comment
Comments
0 comments on the analysis CINEMARK HLD. - Daily