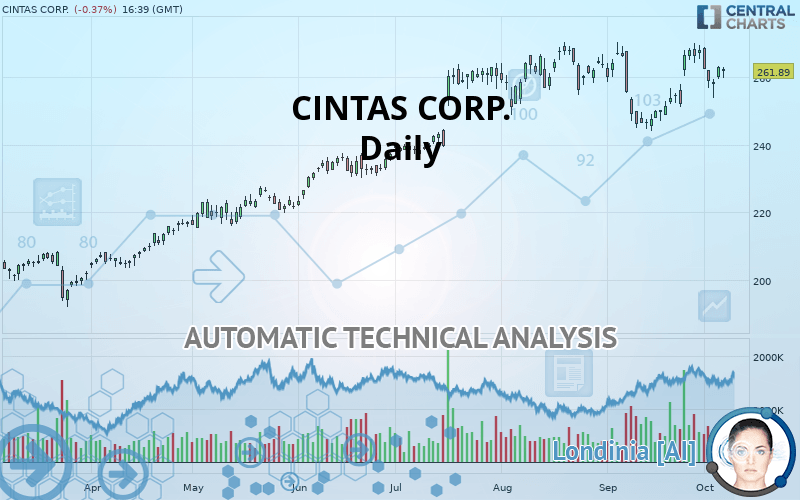
CINTAS CORP. - Daily - Technical analysis published on 10/07/2019 (GMT)
- Who voted?
- 287
- 0
Click here for a new analysis!
- Timeframe : Daily
- - Analysis generated on
- Status : TARGET REACHED

Summary of the analysis

Additional analysis
Quotes
The CINTAS CORP. price is 261.89 USD. The price registered a decrease of -0.37% on the session and was traded between 259.78 USD and 262.95 USD over the period. The price is currently at +0.81% from its lowest and -0.40% from its highest.The Central Gaps scanner detects a bearish opening marking the presence of sellers ahead of buyers at the opening but not sufficiently marked to allow the price to register a quotation gap.
Bearish opening
Type : Bearish
Timeframe : Openning
So that you have an overall view of the price change, here is a table showing the variations over several periods:
Near a new HIGH record (5 years)
Type : Bullish
Timeframe : Weekly
Near a new HIGH record (1 year)
Type : Bullish
Timeframe : Weekly
Near a new HIGH record (1st january)
Type : Bullish
Timeframe : Weekly
Near a new HIGH record (1 month)
Type : Bullish
Timeframe : Weekly
Technical
A technical analysis in Daily of this CINTAS CORP. chart shows a strongly bullish trend. 89.29% of the signals given by moving averages are bullish. The overall trend is supported by the strong bullish signals from short-term moving averages. The Central Indicators scanner detects bullish signals on moving averages that could impact this trend:
Bullish trend reversal : Moving Average 50
Type : Bullish
Timeframe : Daily
Bullish price crossover with Moving Average 50
Type : Bullish
Timeframe : Daily
Bullish price crossover with adaptative moving average 50
Type : Bullish
Timeframe : Daily
An assessment of technical indicators shows a moderate bullish signal.
Other results related to technical indicators were also found by the Central Indicators scanner:
Ichimoku : price is over the cloud
Type : Bullish
Timeframe : Daily
Price is back over the pivot point
Type : Bullish
Timeframe : Daily
An analysis of the price chart with the Central Patterns scanner (detector of chart patterns and resistances and supports) shows a result that can have an impact on the price change:
Near resistance of channel
Type : Bearish
Timeframe : Daily
The presence of these bullish Japanese candlestick patterns detected by Central Candlesticks that could cause a very short term rebound were also noted:
White morning star
Type : Bullish
Timeframe : Daily
Upside gap
Type : Bullish
Timeframe : Daily
| S3 | S2 | S1 | Price | R1 | |
|---|---|---|---|---|---|
| ProTrendLines | 216.40 | 246.02 | 256.27 | 261.89 | 267.84 |
| Change (%) | -17.37% | -6.06% | -2.15% | - | +2.27% |
| Change | -45.49 | -15.87 | -5.62 | - | +5.95 |
| Level | Major | Major | Minor | - | Major |
Pivot points can also be used to set your price objectives. Here is the price situation in relation to pivot points:
| Pivot points | S3 | S2 | S1 | PP | R1 | R2 | R3 |
|---|---|---|---|---|---|---|---|
| Standard | 256.79 | 258.13 | 260.50 | 261.84 | 264.21 | 265.55 | 267.92 |
| Camarilla | 261.84 | 262.18 | 262.52 | 262.86 | 263.20 | 263.54 | 263.88 |
| Woodie | 257.29 | 258.39 | 261.00 | 262.10 | 264.72 | 265.81 | 268.43 |
| Fibonacci | 258.13 | 259.55 | 260.43 | 261.84 | 263.26 | 264.14 | 265.55 |
| Pivot points | S3 | S2 | S1 | PP | R1 | R2 | R3 |
|---|---|---|---|---|---|---|---|
| Standard | 238.94 | 246.40 | 254.63 | 262.09 | 270.32 | 277.78 | 286.01 |
| Camarilla | 258.55 | 259.98 | 261.42 | 262.86 | 264.30 | 265.74 | 267.18 |
| Woodie | 239.33 | 246.59 | 255.02 | 262.28 | 270.71 | 277.97 | 286.40 |
| Fibonacci | 246.40 | 252.39 | 256.10 | 262.09 | 268.08 | 271.79 | 277.78 |
| Pivot points | S3 | S2 | S1 | PP | R1 | R2 | R3 |
|---|---|---|---|---|---|---|---|
| Standard | 225.08 | 234.54 | 251.32 | 260.78 | 277.56 | 287.02 | 303.80 |
| Camarilla | 260.88 | 263.29 | 265.70 | 268.10 | 270.51 | 272.91 | 275.32 |
| Woodie | 228.74 | 236.37 | 254.98 | 262.61 | 281.22 | 288.85 | 307.46 |
| Fibonacci | 234.54 | 244.56 | 250.76 | 260.78 | 270.80 | 277.00 | 287.02 |
Numerical data
The following is the status of the technical indicators and moving averages at the time of publication of this technical analysis:
| RSI (14): | 53.66 | |
| MACD (12,26,9): | 1.4900 | |
| Directional Movement: | 1.04 | |
| AROON (14): | 50.00 | |
| DEMA (21): | 261.09 | |
| Parabolic SAR (0,02-0,02-0,2): | 253.86 | |
| Elder Ray (13): | 0.92 | |
| Super Trend (3,10): | 250.66 | |
| Zig ZAG (10): | 262.51 | |
| VORTEX (21): | 0.8700 | |
| Stochastique (14,3,5): | 63.90 | |
| TEMA (21): | 262.06 | |
| Williams %R (14): | -34.02 | |
| Chande Momentum Oscillator (20): | 10.62 | |
| Repulse (5,40,3): | 0.9300 | |
| ROCnROLL: | 1 | |
| TRIX (15,9): | 0.0300 | |
| Courbe Coppock: | 9.98 |
| MA7: | 262.72 | |
| MA20: | 256.04 | |
| MA50: | 259.49 | |
| MA100: | 248.05 | |
| MAexp7: | 261.51 | |
| MAexp20: | 259.52 | |
| MAexp50: | 256.35 | |
| MAexp100: | 247.07 | |
| Price / MA7: | -0.32% | |
| Price / MA20: | +2.28% | |
| Price / MA50: | +0.92% | |
| Price / MA100: | +5.58% | |
| Price / MAexp7: | +0.15% | |
| Price / MAexp20: | +0.91% | |
| Price / MAexp50: | +2.16% | |
| Price / MAexp100: | +6.00% |
 Cintas
About author

Online


Add a comment
Comments
0 comments on the analysis CINTAS CORP. - Daily