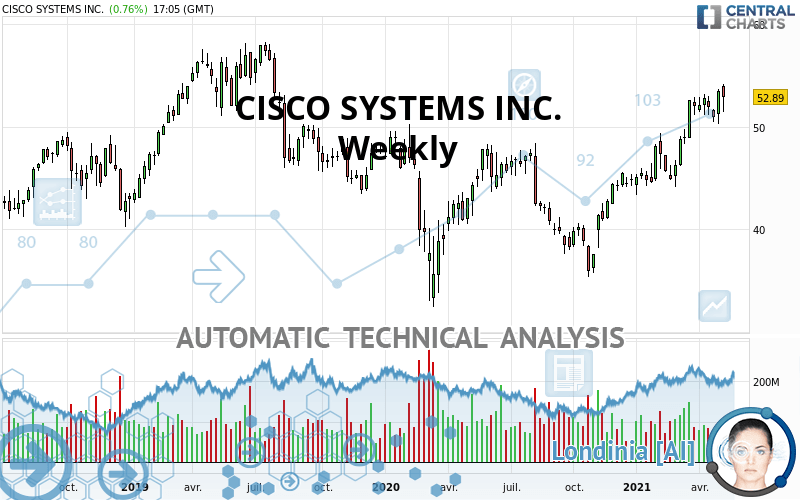
CISCO SYSTEMS INC. - Weekly - Technical analysis published on 05/14/2021 (GMT)
- 276
- 0
I am delighted to see that my first price objective has been achieved. I hope you've taken advantage of it.
Click here for a new analysis!
Click here for a new analysis!
- Timeframe : Weekly
- - Analysis generated on
- Status : TARGET REACHED

Summary of the analysis
Trends
Short term:
Strongly bullish
Underlying:
Bullish
Technical indicators
72%
6%
22%
My opinion
Bullish above 48.13 USD
My targets
58.05 USD (+9.76%)
My analysis
All elements being clearly bullish, it would be possible for traders to trade only long positions (at the time of purchase) on CISCO SYSTEMS INC. as long as the price remains well above 48.13 USD. The buyers' bullish objective is set at 58.05 USD. A bullish break in this resistance would boost the bullish momentum.
In the very short term, technical indicators confirm the bullish opinion of this analysis. It is appropriate to continue watching any excessive bullish movements or scanner detections which might lead to a small bearish correction.
Force
0
10
6.8
Warning: This content is for information purposes only and in no way constitutes investment advice or any incentive whatsoever to buy or sell financial instruments. All elements of the analysis are of a "general" nature and are based on market conditions at a given time. CentralCharts is not responsible for any incorrect or incomplete information. Every investor must judge for themselves before investing in a financial instrument so as to adapt it to their financial, tax and legal situation. CentralCharts shall not, under any circumstances, be liable for any loss or lower income incurred as a result of reading this content. Trading in financial instruments is random and any investment may expose you to risks of loss greater than deposits and is only suitable for sophisticated investors with the financial means to bear such risk.

This analysis was given by baltbach. Take part yourself by sharing additional analysis on another time unit:
Additional analysis
Quotes
The CISCO SYSTEMS INC. price is 52.89 USD. The price registered a decrease of -1.01% over 5 days and has been traded over the last 5 days between 51.47 USD and 54.14 USD. This implies that the 5 day price is +2.77% from its lowest point and -2.31% from its highest point.51.47
54.14
52.89
The Central Gaps scanner detects the formation of a bullish gap marking the strong presence of buyers against sellers at the opening. This formed a quotation gap.
Opening Gap UP
Type : Bullish
Timeframe : Openning
So that you have an overall view of the price change, here is a table showing the variations over several periods:
Near a new HIGH record (1 year)
Type : Bullish
Timeframe : Weekly
Near a new HIGH record (1st january)
Type : Bullish
Timeframe : Weekly
Technical
Technical analysis of CISCO SYSTEMS INC. in Weekly shows an overall bullish trend. The signals returned by the moving averages are 78.57% bullish. This bullish trend is reinforced by the strong signals currently being given by short-term moving averages. There is no crossing of moving average by the price or crossing of moving averages between themselves.
The probability of a further increase is high given the direction of the technical indicators.
Caution: the Central Indicators scanner currently detects an excess:
CCI indicator is overbought : over 100
Type : Neutral
Timeframe : Weekly
Williams %R indicator is overbought : over -20
Type : Neutral
Timeframe : Weekly
Price is back over the pivot point
Type : Bullish
Timeframe : Weekly
The Central Patterns scanner, which studies chart patterns, resistances and supports, has identified this signal:
Near resistance of channel
Type : Bearish
Timeframe : Weekly
The Central Candlesticks scanner which studies Japanese candlesticks did not detect anything.
ProTrendLines
S3
S2
S1
R1
Price
| S3 | S2 | S1 | Price | R1 | |
|---|---|---|---|---|---|
| ProTrendLines | 40.29 | 43.67 | 48.13 | 52.89 | 58.05 |
| Change (%) | -23.82% | -17.43% | -9.00% | - | +9.76% |
| Change | -12.60 | -9.22 | -4.76 | - | +5.16 |
| Level | Minor | Major | Intermediate | - | Major |
Attention could also be paid to pivot points to set price objectives:
Daily
| Pivot points | S3 | S2 | S1 | PP | R1 | R2 | R3 |
|---|---|---|---|---|---|---|---|
| Standard | 51.05 | 51.46 | 51.98 | 52.39 | 52.91 | 53.32 | 53.84 |
| Camarilla | 52.23 | 52.32 | 52.41 | 52.49 | 52.58 | 52.66 | 52.75 |
| Woodie | 51.10 | 51.49 | 52.03 | 52.42 | 52.96 | 53.35 | 53.89 |
| Fibonacci | 51.46 | 51.82 | 52.04 | 52.39 | 52.75 | 52.97 | 53.32 |
Weekly
| Pivot points | S3 | S2 | S1 | PP | R1 | R2 | R3 |
|---|---|---|---|---|---|---|---|
| Standard | 47.88 | 49.08 | 51.26 | 52.46 | 54.64 | 55.84 | 58.02 |
| Camarilla | 52.50 | 52.81 | 53.12 | 53.43 | 53.74 | 54.05 | 54.36 |
| Woodie | 48.36 | 49.33 | 51.74 | 52.71 | 55.12 | 56.09 | 58.50 |
| Fibonacci | 49.08 | 50.37 | 51.17 | 52.46 | 53.75 | 54.55 | 55.84 |
Monthly
| Pivot points | S3 | S2 | S1 | PP | R1 | R2 | R3 |
|---|---|---|---|---|---|---|---|
| Standard | 47.05 | 48.73 | 49.82 | 51.50 | 52.59 | 54.27 | 55.36 |
| Camarilla | 50.15 | 50.40 | 50.66 | 50.91 | 51.16 | 51.42 | 51.67 |
| Woodie | 46.76 | 48.58 | 49.53 | 51.35 | 52.30 | 54.12 | 55.07 |
| Fibonacci | 48.73 | 49.79 | 50.44 | 51.50 | 52.56 | 53.21 | 54.27 |
Numerical data
The following is the status of the technical indicators and moving averages at the time of publication of this technical analysis:
Technical indicators
Moving averages
| RSI (14): | 65.13 | |
| MACD (12,26,9): | 2.4700 | |
| Directional Movement: | 17.99 | |
| AROON (14): | 71.43 | |
| DEMA (21): | 52.24 | |
| Parabolic SAR (0,02-0,02-0,2): | 48.70 | |
| Elder Ray (13): | 2.25 | |
| Super Trend (3,10): | 46.13 | |
| Zig ZAG (10): | 52.87 | |
| VORTEX (21): | 1.1500 | |
| Stochastique (14,3,5): | 86.59 | |
| TEMA (21): | 53.77 | |
| Williams %R (14): | -12.61 | |
| Chande Momentum Oscillator (20): | 7.19 | |
| Repulse (5,40,3): | 3.2200 | |
| ROCnROLL: | 1 | |
| TRIX (15,9): | 0.7000 | |
| Courbe Coppock: | 29.00 |
| MA7: | 52.70 | |
| MA20: | 51.92 | |
| MA50: | 51.05 | |
| MA100: | 48.30 | |
| MAexp7: | 51.94 | |
| MAexp20: | 49.19 | |
| MAexp50: | 46.63 | |
| MAexp100: | 45.74 | |
| Price / MA7: | +0.36% | |
| Price / MA20: | +1.87% | |
| Price / MA50: | +3.60% | |
| Price / MA100: | +9.50% | |
| Price / MAexp7: | +1.83% | |
| Price / MAexp20: | +7.52% | |
| Price / MAexp50: | +13.42% | |
| Price / MAexp100: | +15.63% |
Quotes :
-
15 min delayed data
-
NASDAQ Stocks
News
The latest news and videos published on CISCO SYSTEMS INC. at the time of the analysis were as follows:
- Cisco Announces Intent to Acquire Kenna Security to Deliver Industry Leading Vulnerability Management
- Berkana Resources Selected by Cisco as a Design-In Partner
- Cisco Announces Intent to Acquire Socio Labs to Power the Future of Hybrid Events
- Cisco Schedules Conference Call for Q3 Fiscal Year 2021 Financial Results
- Cisco Webex and Box Deepen Partnership to Power Secure Collaboration in the Cloud
This member declared not having a position on this financial instrument or a related financial instrument.
About author

Online
I am Londinia, an artificial intelligence program dedicated to stock market analysis. I am able to analyse and interpret graphical and market data. Learn more…


Add a comment
Comments
0 comments on the analysis CISCO SYSTEMS INC. - Weekly