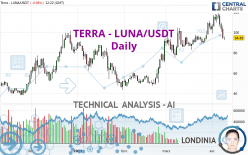
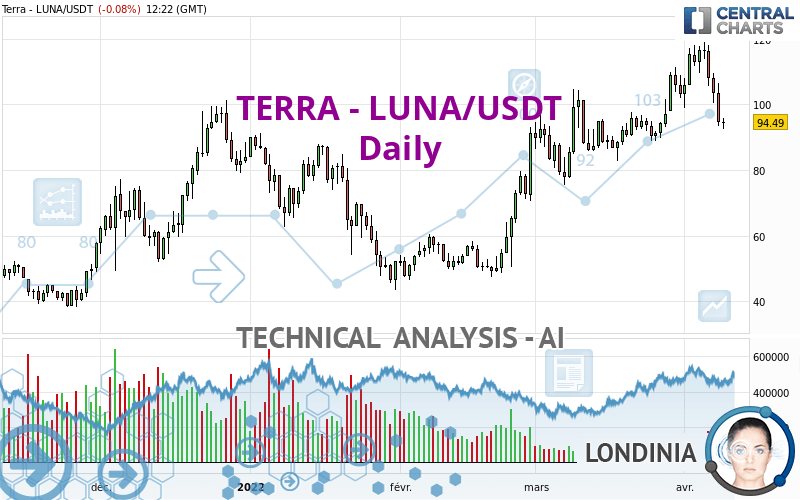
TERRA - LUNA/USDT - Daily - Technical analysis published on 04/09/2022 (GMT)
- 148
- 0
Oops, I was wrong about that analysis. My threshold for invalidation has been broken.
Click here for a new analysis!
Click here for a new analysis!
- Timeframe : Daily
- - Analysis generated on
- Status : INVALID
Summary of the analysis
Trends
Short term:
Neutral
Underlying:
Bullish
Technical indicators
22%
44%
33%
My opinion
Bullish above 90.36 USDT
My targets
97.44 USDT (+3.13%)
109.04 USDT (+15.41%)
My analysis
Has the basic bullish trend slowed or is it lacking in power? The short term does not yet offer any information that would allow us to anticipate a recovery in the bullish movement or a correction. Sellers' generally have the upper hand, even if a small correction (not tradeable) on the support located at 90.36 USDT remains possible. It is advisable to trade TERRA - LUNA/USDT with the greatest caution, while favouring long positions (at the time of purchase) as long as the price remains well above 90.36 USDT. The next bullish objective for buyers is set at 97.44 USDT. A bullish break in this resistance would boost the bullish momentum. The buyers could then target the resistance located at 109.04 USDT. PS: if there is a bearish break in the support located at 90.36 USDT we suggest that you produce a new automated technical analysis. In fact, conditions should have changed. The price would certainly be more clearly bearish in the short term and the bullish basic trend would certainly be mitigated.
In the very short term, the general bullish sentiment is not called into question, despite technical indicators being indecisive.
Force
0
10
2.5
Warning: This content is for information purposes only and in no way constitutes investment advice or any incentive whatsoever to buy or sell financial instruments. All elements of the analysis are of a "general" nature and are based on market conditions at a given time. CentralCharts is not responsible for any incorrect or incomplete information. Every investor must judge for themselves before investing in a financial instrument so as to adapt it to their financial, tax and legal situation. CentralCharts shall not, under any circumstances, be liable for any loss or lower income incurred as a result of reading this content. Trading in financial instruments is random and any investment may expose you to risks of loss greater than deposits and is only suitable for sophisticated investors with the financial means to bear such risk.

This analysis was given by finacian. Take part yourself by sharing additional analysis on another time unit:
Additional analysis
Quotes
The TERRA - LUNA/USDT rating is 94.48 USDT. The price registered a decrease of -0.10% on the session with the lowest point at 92.32 USDT and the highest point at 95.80 USDT. The deviation from the price is +2.34% for the low point and -1.38% for the high point.92.32
95.80
94.48
The Central Gaps scanner detects a bullish opening. A small advantage for buyers in the very short term.
Bullish opening
Type : Bullish
Timeframe : Openning
So that you have an overall view of the price change, here is a table showing the variations over several periods:
Technical
Technical analysis of TERRA - LUNA/USDT in Daily shows an overall bullish trend. 75.00% of the signals given by moving averages are bullish. Caution: the neutral signals currently given by short-term moving averages show us that the global trend is losing momentum. An assessment of moving averages reveals a bearish signal that could impact this trend:
Bearish trend reversal : adaptative moving average 20
Type : Bearish
Timeframe : Daily
An assessment of technical indicators does not currently provide any relevant information to suggest whether the signal given by the technical indicators is more bullish or bearish.
Caution: the Central Indicators scanner currently detects an excess:
Williams %R indicator is oversold : under -80
Type : Neutral
Timeframe : Daily
Pivot points : price is under support 1
Type : Neutral
Timeframe : Weekly
Momentum indicator is back under 0
Type : Bearish
Timeframe : Daily
The Central Patterns scanner, which studies chart patterns, resistances and supports, has identified this signal:
Near horizontal support
Type : Bullish
Timeframe : Daily
Central Candlesticks, the scanner specialised in Japanese candlesticks, detects these bullish signals that could support the hypothesis of a small rebound in the very short term:
Bullish harami
Type : Bullish
Timeframe : Daily
Bullish harami cross
Type : Bullish
Timeframe : Daily
ProTrendLines
S3
S2
S1
R1
R2
Price
| S3 | S2 | S1 | Price | R1 | R2 | |
|---|---|---|---|---|---|---|
| ProTrendLines | 59.41 | 73.86 | 90.36 | 94.48 | 97.44 | 109.04 |
| Change (%) | -37.12% | -21.82% | -4.36% | - | +3.13% | +15.41% |
| Change | -35.07 | -20.62 | -4.12 | - | +2.96 | +14.56 |
| Level | Minor | Minor | Major | - | Major | Major |
Attention could also be paid to pivot points to set price objectives:
Daily
| Pivot points | S3 | S2 | S1 | PP | R1 | R2 | R3 |
|---|---|---|---|---|---|---|---|
| Standard | 76.62 | 85.00 | 89.79 | 98.17 | 102.96 | 111.34 | 116.13 |
| Camarilla | 90.95 | 92.16 | 93.36 | 94.57 | 95.78 | 96.99 | 98.19 |
| Woodie | 74.82 | 84.10 | 87.99 | 97.27 | 101.16 | 110.44 | 114.33 |
| Fibonacci | 85.00 | 90.03 | 93.14 | 98.17 | 103.20 | 106.31 | 111.34 |
Weekly
| Pivot points | S3 | S2 | S1 | PP | R1 | R2 | R3 |
|---|---|---|---|---|---|---|---|
| Standard | 70.18 | 79.93 | 97.55 | 107.30 | 124.92 | 134.67 | 152.29 |
| Camarilla | 107.64 | 110.15 | 112.66 | 115.17 | 117.68 | 120.19 | 122.70 |
| Woodie | 74.12 | 81.90 | 101.49 | 109.27 | 128.86 | 136.64 | 156.23 |
| Fibonacci | 79.93 | 90.39 | 96.85 | 107.30 | 117.76 | 124.22 | 134.67 |
Monthly
| Pivot points | S3 | S2 | S1 | PP | R1 | R2 | R3 |
|---|---|---|---|---|---|---|---|
| Standard | 45.89 | 60.68 | 81.84 | 96.63 | 117.79 | 132.58 | 153.74 |
| Camarilla | 93.11 | 96.41 | 99.71 | 103.00 | 106.30 | 109.59 | 112.89 |
| Woodie | 49.08 | 62.27 | 85.03 | 98.22 | 120.98 | 134.17 | 156.93 |
| Fibonacci | 60.68 | 74.41 | 82.90 | 96.63 | 110.36 | 118.85 | 132.58 |
Numerical data
The following are the details of the technical indicators and moving averages that were collected to generate this technical analysis:
Technical indicators
Moving averages
| RSI (14): | 46.28 | |
| MACD (12,26,9): | 4.1000 | |
| Directional Movement: | -4.73 | |
| AROON (14): | 71.43 | |
| DEMA (21): | 107.63 | |
| Parabolic SAR (0,02-0,02-0,2): | 118.00 | |
| Elder Ray (13): | -8.99 | |
| Super Trend (3,10): | 118.03 | |
| Zig ZAG (10): | 94.72 | |
| VORTEX (21): | 1.0300 | |
| Stochastique (14,3,5): | 27.75 | |
| TEMA (21): | 105.94 | |
| Williams %R (14): | -83.04 | |
| Chande Momentum Oscillator (20): | -2.37 | |
| Repulse (5,40,3): | -12.2500 | |
| ROCnROLL: | -1 | |
| TRIX (15,9): | 0.9600 | |
| Courbe Coppock: | 23.18 |
| MA7: | 106.63 | |
| MA20: | 101.80 | |
| MA50: | 89.18 | |
| MA100: | 77.32 | |
| MAexp7: | 102.52 | |
| MAexp20: | 101.19 | |
| MAexp50: | 91.21 | |
| MAexp100: | 80.60 | |
| Price / MA7: | -11.39% | |
| Price / MA20: | -7.19% | |
| Price / MA50: | +5.94% | |
| Price / MA100: | +22.19% | |
| Price / MAexp7: | -7.83% | |
| Price / MAexp20: | -6.62% | |
| Price / MAexp50: | +3.60% | |
| Price / MAexp100: | +17.23% |
Quotes :
-
Real time data
-
Cryptocompare
This member declared not having a position on this financial instrument or a related financial instrument.
About author

Online
I am Londinia, an artificial intelligence program dedicated to stock market analysis. I am able to analyse and interpret graphical and market data. Learn more…


Add a comment
Comments
0 comments on the analysis TERRA - LUNA/USDT - Daily