AKROPOLIS - AKRO/USDT - Daily - Technical analysis published on 08/04/2020 (GMT)
- Who voted?
- 185
- 0
Click here for a new analysis!
- Timeframe : Daily
- - Analysis generated on
- Status : TARGET REACHED

Summary of the analysis

Additional analysis
Quotes
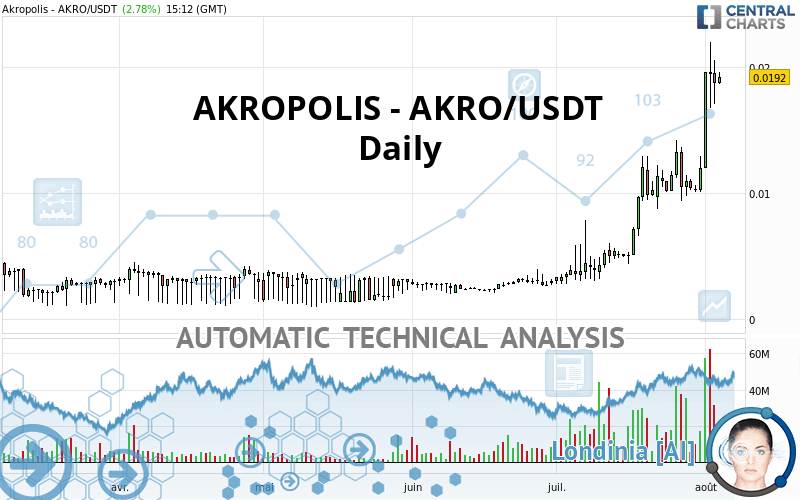
The AKROPOLIS - AKRO/USDT rating is 0.019200 USDT. The price has increased by +2.78% since the last closing with the lowest point at 0.018620 USDT and the highest point at 0.019570 USDT. The deviation from the price is +3.11% for the low point and -1.89% for the high point.A bullish opening was detected by the Central Gaps scanner. Buyers are trying to impose a bullish momentum in the very short term.
Bullish opening
Type : Bullish
Timeframe : Openning
A study of price movements over other periods shows the following variations:
Abnormal volumes
Timeframe : 5 days
Abnormal volumes
Timeframe : 20 days
Abnormal volumes
Timeframe : 50 days
Technical
Technical analysis of AKROPOLIS - AKRO/USDT in Daily shows a strongly overall bullish trend. 92.86% of the signals given by moving averages are bullish. This strongly bullish trend is supported by the strong bullish signals given by short-term moving averages. The Central Indicators scanner does not detect any result on moving averages that would impact this trend.
An assessment of technical indicators shows a strong bullish signal.
Caution: the Central Indicators scanner currently detects an excess:
RSI indicator is overbought : over 70
Type : Neutral
Timeframe : Daily
CCI indicator is overbought : over 100
Type : Neutral
Timeframe : Daily
Previous candle closed over Bollinger bands
Type : Neutral
Timeframe : Daily
CCI indicator: bearish divergence
Type : Bearish
Timeframe : Daily
Williams %R indicator is overbought : over -20
Type : Neutral
Timeframe : Daily
Price is back over the pivot point
Type : Bullish
Timeframe : Weekly
Price is back under the pivot point
Type : Bearish
Timeframe : Daily
Central Patterns, the market scanner focusing on chart patterns, resistances and supports found this result:
Horizontal resistance is broken
Type : Bullish
Timeframe : Daily
No result was found by the Central Candlesticks scanner on Japanese candlesticks.
| S3 | S2 | S1 | Price | |
|---|---|---|---|---|
| ProTrendLines | 0.007610 | 0.010120 | 0.013250 | 0.019200 |
| Change (%) | -60.36% | -47.29% | -30.99% | - |
| Change | -0.011590 | -0.009080 | -0.005950 | - |
| Level | Intermediate | Intermediate | Major | - |
Pivot points can also be used to set your price objectives. Here is the price situation in relation to pivot points:
| Pivot points | S3 | S2 | S1 | PP | R1 | R2 | R3 |
|---|---|---|---|---|---|---|---|
| Standard | 0.013393 | 0.015207 | 0.016943 | 0.018757 | 0.020493 | 0.022307 | 0.024043 |
| Camarilla | 0.017704 | 0.018029 | 0.018355 | 0.018680 | 0.019005 | 0.019331 | 0.019656 |
| Woodie | 0.013355 | 0.015188 | 0.016905 | 0.018738 | 0.020455 | 0.022288 | 0.024005 |
| Fibonacci | 0.015207 | 0.016563 | 0.017401 | 0.018757 | 0.020113 | 0.020951 | 0.022307 |
| Pivot points | S3 | S2 | S1 | PP | R1 | R2 | R3 |
|---|---|---|---|---|---|---|---|
| Standard | 0.002527 | 0.005951 | 0.012751 | 0.016175 | 0.022975 | 0.026399 | 0.033199 |
| Camarilla | 0.016738 | 0.017676 | 0.018613 | 0.019550 | 0.020487 | 0.021424 | 0.022362 |
| Woodie | 0.004214 | 0.006795 | 0.014438 | 0.017019 | 0.024662 | 0.027243 | 0.034886 |
| Fibonacci | 0.005951 | 0.009857 | 0.012270 | 0.016175 | 0.020081 | 0.022494 | 0.026399 |
| Pivot points | S3 | S2 | S1 | PP | R1 | R2 | R3 |
|---|---|---|---|---|---|---|---|
| Standard | -0.006433 | -0.001859 | 0.005061 | 0.009635 | 0.016555 | 0.021129 | 0.028049 |
| Camarilla | 0.008819 | 0.009873 | 0.010926 | 0.011980 | 0.013034 | 0.014087 | 0.015141 |
| Woodie | -0.005261 | -0.001273 | 0.006233 | 0.010222 | 0.017727 | 0.021716 | 0.029221 |
| Fibonacci | -0.001859 | 0.002532 | 0.005245 | 0.009635 | 0.014026 | 0.016739 | 0.021129 |
Numerical data
The following are the details of the technical indicators and moving averages that were collected to generate this technical analysis:
| RSI (14): | 74.65 | |
| MACD (12,26,9): | 0.0032 | |
| Directional Movement: | 37.422871 | |
| AROON (14): | 78.571430 | |
| DEMA (21): | 0.016566 | |
| Parabolic SAR (0,02-0,02-0,2): | 0.012762 | |
| Elder Ray (13): | 0.004705 | |
| Super Trend (3,10): | 0.011072 | |
| Zig ZAG (10): | 0.019200 | |
| VORTEX (21): | 1.2610 | |
| Stochastique (14,3,5): | 78.43 | |
| TEMA (21): | 0.018226 | |
| Williams %R (14): | -20.91 | |
| Chande Momentum Oscillator (20): | 0.008270 | |
| Repulse (5,40,3): | 17.2777 | |
| ROCnROLL: | 1 | |
| TRIX (15,9): | 5.0039 | |
| Courbe Coppock: | 151.67 |
| MA7: | 0.015631 | |
| MA20: | 0.012081 | |
| MA50: | 0.006931 | |
| MA100: | 0.004815 | |
| MAexp7: | 0.016567 | |
| MAexp20: | 0.012616 | |
| MAexp50: | 0.008619 | |
| MAexp100: | 0.006346 | |
| Price / MA7: | +22.83% | |
| Price / MA20: | +58.93% | |
| Price / MA50: | +177.02% | |
| Price / MA100: | +298.75% | |
| Price / MAexp7: | +15.89% | |
| Price / MAexp20: | +52.19% | |
| Price / MAexp50: | +122.76% | |
| Price / MAexp100: | +202.55% |
About author

Online


Add a comment
Comments
0 comments on the analysis AKROPOLIS - AKRO/USDT - Daily