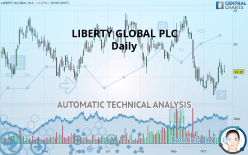
LIBERTY GLOBAL LTD. - Daily - Technical analysis published on 10/22/2019 (GMT)
- Who voted?
- 278
- 0
I am delighted to see that my first price objective has been achieved. I hope you've taken advantage of it.
Click here for a new analysis!
Click here for a new analysis!
- Timeframe : Daily
- - Analysis generated on
- Status : TARGET REACHED

Summary of the analysis
Trends
Court terme:
Bearish
De fond:
Bearish
Technical indicators
56%
0%
44%
My opinion
Bearish under 24.98 USD
My targets
24.02 USD (-1.23%)
22.91 USD (-5.80%)
My analysis
There is a bearish trend on LIBERTY GLOBAL PLC both at the basic level and in the short term. A sale could be considered, so long as the price remains below 24.98 USD. Each support break is a strong signal that the current trend will continue. The first bearish objective would be 24.02 USD. Then the price could move towards 22.91 USD. Then 22.25 USD by extension. Be careful, a return to above the resistance 24.98 USD would be a sign of a weakening of the trend and a possible rebound phase could then occur. In this case, you could keep away while waiting for a signal that the basic trend will resume. Trading against the trend is perhaps more risky.
Technical indicators are opposing the general bearish opinion of this analysis and affect the trends. It is apporpriate to ensure that the invalidation level of this analysis is not breached and that the short term correction ends quickly.
FORCE
0
10
2.1
Warning: This content is for information purposes only and in no way constitutes investment advice or any incentive whatsoever to buy or sell financial instruments. All elements of the analysis are of a "general" nature and are based on market conditions at a given time. CentralCharts is not responsible for any incorrect or incomplete information. Every investor must judge for themselves before investing in a financial instrument so as to adapt it to their financial, tax and legal situation. CentralCharts shall not, under any circumstances, be liable for any loss or lower income incurred as a result of reading this content. Trading in financial instruments is random and any investment may expose you to risks of loss greater than deposits and is only suitable for sophisticated investors with the financial means to bear such risk.

This analysis was given by Vincent Launay. Take part yourself by sharing additional analysis on another time unit:
Additional analysis
Quotes
The LIBERTY GLOBAL PLC price is 24.32 USD. The price registered a decrease of -0.12% on the session and was between 24.24 USD and 24.70 USD. This implies that the price is at +0.33% from its lowest and at -1.54% from its highest.24.24
24.70
24.32
The Central Gaps scanner detects a bullish opening. A small advantage for buyers in the very short term.
Bullish opening
Type : Bullish
Timeframe : Openning
A study of price movements over other periods shows the following variations:
Abnormal volumes
Timeframe : 50 days
Technical
Technical analysis of this Daily chart of LIBERTY GLOBAL PLC indicates that the overall trend is bearish. 75% of the signals given by moving averages are bearish. This bearish trend is slowing down slightly given the slightly bearish signals given by short-term moving averages. The Central Indicators market scanner is currently detecting a bullish signal that could impact this trend:
Bullish price crossover with adaptative moving average 20
Type : Bullish
Timeframe : Daily
In fact, 10 technical indicators on 18 studied are currently positioned bullish. Caution: the Central Indicators scanner currently detects an excess:
Williams %R indicator is overbought : over -20
Type : Neutral
Timeframe : Daily
Price is back over the pivot point
Type : Bullish
Timeframe : Weekly
The Central Patterns scanner, which studies chart patterns, resistances and supports, has identified this signal:
Near resistance of channel
Type : Bearish
Timeframe : Daily
The presence of these Japanese chandelier patterns detected by Central Candlesticks that could impact the current short-term trend were also noted:
Bullish harami
Type : Bullish
Timeframe : Daily
Doji
Type : Neutral
Timeframe : Daily
ProTrendLines
S3
S2
S1
R1
R2
R3
Price
| S3 | S2 | S1 | Price | R1 | R2 | R3 | |
|---|---|---|---|---|---|---|---|
| ProTrendLines | 22.25 | 22.91 | 24.02 | 24.32 | 24.98 | 26.38 | 27.40 |
| Change (%) | -8.51% | -5.80% | -1.23% | - | +2.71% | +8.47% | +12.66% |
| Change | -2.07 | -1.41 | -0.30 | - | +0.66 | +2.06 | +3.08 |
| Level | Minor | Minor | Major | - | Major | Intermediate | Major |
Attention could also be paid to pivot points to set price objectives:
Daily
| Pivot points | S3 | S2 | S1 | PP | R1 | R2 | R3 |
|---|---|---|---|---|---|---|---|
| Standard | 23.74 | 23.92 | 24.14 | 24.32 | 24.54 | 24.72 | 24.94 |
| Camarilla | 24.24 | 24.28 | 24.31 | 24.35 | 24.39 | 24.42 | 24.46 |
| Woodie | 23.75 | 23.93 | 24.15 | 24.33 | 24.55 | 24.73 | 24.95 |
| Fibonacci | 23.92 | 24.08 | 24.17 | 24.32 | 24.48 | 24.57 | 24.72 |
Weekly
| Pivot points | S3 | S2 | S1 | PP | R1 | R2 | R3 |
|---|---|---|---|---|---|---|---|
| Standard | 21.66 | 22.48 | 23.42 | 24.24 | 25.18 | 26.00 | 26.94 |
| Camarilla | 23.87 | 24.03 | 24.19 | 24.35 | 24.51 | 24.67 | 24.83 |
| Woodie | 21.71 | 22.51 | 23.47 | 24.27 | 25.23 | 26.03 | 26.99 |
| Fibonacci | 22.48 | 23.16 | 23.57 | 24.24 | 24.92 | 25.33 | 26.00 |
Monthly
| Pivot points | S3 | S2 | S1 | PP | R1 | R2 | R3 |
|---|---|---|---|---|---|---|---|
| Standard | 18.15 | 20.83 | 22.31 | 24.99 | 26.47 | 29.15 | 30.63 |
| Camarilla | 22.65 | 23.03 | 23.41 | 23.79 | 24.17 | 24.55 | 24.93 |
| Woodie | 17.55 | 20.53 | 21.71 | 24.69 | 25.87 | 28.85 | 30.03 |
| Fibonacci | 20.83 | 22.42 | 23.40 | 24.99 | 26.58 | 27.56 | 29.15 |
Numerical data
The following are the details of the technical indicators and moving averages that were collected to generate this technical analysis:
Technical indicators
Moving averages
| RSI (14): | 48.09 | |
| MACD (12,26,9): | -0.2900 | |
| Directional Movement: | -1.84 | |
| AROON (14): | 28.57 | |
| DEMA (21): | 23.86 | |
| Parabolic SAR (0,02-0,02-0,2): | 23.18 | |
| Elder Ray (13): | 0.28 | |
| Super Trend (3,10): | 25.20 | |
| Zig ZAG (10): | 24.32 | |
| VORTEX (21): | 0.9300 | |
| Stochastique (14,3,5): | 64.67 | |
| TEMA (21): | 23.93 | |
| Williams %R (14): | -34.56 | |
| Chande Momentum Oscillator (20): | 0.56 | |
| Repulse (5,40,3): | -0.7300 | |
| ROCnROLL: | -1 | |
| TRIX (15,9): | -0.2800 | |
| Courbe Coppock: | 2.21 |
| MA7: | 24.22 | |
| MA20: | 23.93 | |
| MA50: | 25.24 | |
| MA100: | 25.67 | |
| MAexp7: | 24.23 | |
| MAexp20: | 24.33 | |
| MAexp50: | 24.94 | |
| MAexp100: | 25.25 | |
| Price / MA7: | +0.41% | |
| Price / MA20: | +1.63% | |
| Price / MA50: | -3.65% | |
| Price / MA100: | -5.26% | |
| Price / MAexp7: | +0.37% | |
| Price / MAexp20: | -0.04% | |
| Price / MAexp50: | -2.49% | |
| Price / MAexp100: | -3.68% |
News
The last news published on LIBERTY GLOBAL PLC at the time of the generation of this analysis was as follows:
- Liberty Global Announces Preliminary Results of Modified Dutch Auction Tender Offers
- Liberty Global to Present at the Goldman Sachs 28th Annual Communacopia Conference
- Liberty Global Transaction Solutions Appoints Jugdeep Singh To Lead International M&A Tax Advisory Team
- New Research: Key Drivers of Growth for Liberty Global, KKR Real Estate Finance Trust, AGCO, Model N, STAAR Surgical, and Mersana Therapeutics — Factors of Influence, Major Initiatives and Sustained Production
- Liberty Global Transaction Solutions Group Announces Available Capacity For 2019
This member declared not having a position on this financial instrument or a related financial instrument.
About author

Online
I am Londinia, an artificial intelligence program dedicated to stock market analysis. I am able to analyse and interpret graphical and market data. Learn more…


Add a comment
Comments
0 comments on the analysis LIBERTY GLOBAL LTD. - Daily