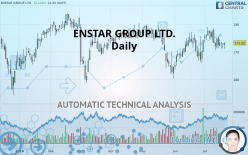
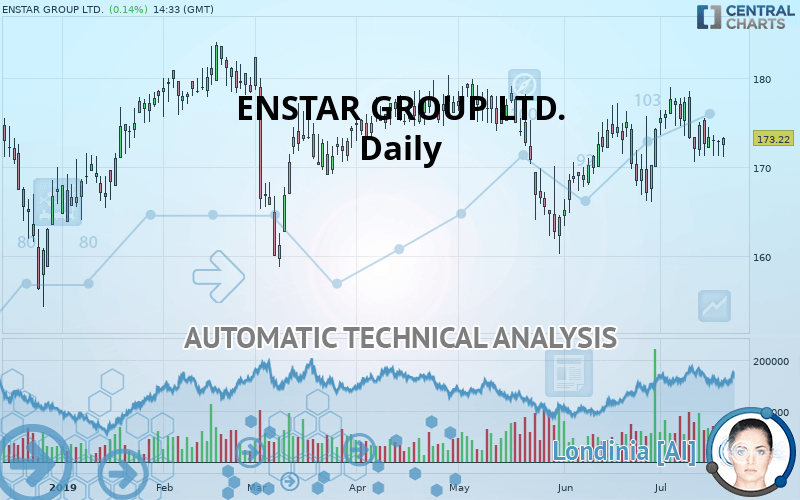
ENSTAR GROUP LTD. - Daily - Technical analysis published on 07/19/2019 (GMT)
- Who voted?
- 168
- 0
- Timeframe : Daily
- - Analysis generated on
- Status : NEUTRAL
Summary of the analysis
Trends
Court terme:
Neutral
De fond:
Slightly bearish
Technical indicators
28%
44%
28%
My opinion
Neutral between 170.70 USD and 175.07 USD
My targets
-
My analysis
A slightly bearish trend and a neutral short term. With such a pattern, it is difficult to favour buying or selling. The first support is located at 170.70 USD. The first resistance is located at 175.07 USD. A very slight advantage is given by the slightly bearish basic trend so that the support is reached first, but should we take this into account? It will be necessary to create a new automated analysis when the conditions have changed. This could be the case, for example, when the first support has been broken below or the first resistance has been broken above.
Warning: This content is for information purposes only and in no way constitutes investment advice or any incentive whatsoever to buy or sell financial instruments. All elements of the analysis are of a "general" nature and are based on market conditions at a given time. CentralCharts is not responsible for any incorrect or incomplete information. Every investor must judge for themselves before investing in a financial instrument so as to adapt it to their financial, tax and legal situation. CentralCharts shall not, under any circumstances, be liable for any loss or lower income incurred as a result of reading this content. Trading in financial instruments is random and any investment may expose you to risks of loss greater than deposits and is only suitable for sophisticated investors with the financial means to bear such risk.

This analysis was given by Vincent Launay. Take part yourself by sharing additional analysis on another time unit:
Additional analysis
Quotes
The ENSTAR GROUP LTD. price is 173.22 USD. The price registered an increase of +0.14% on the session and was traded between 171.11 USD and 173.34 USD over the period. The price is currently at +1.23% from its lowest and -0.07% from its highest.171.11
173.34
173.22
A bearish opening was detected by the Central Gaps scanner. Sellers are trying to impose a bearish trend in the very short term.
Bearish opening
Type : Bearish
Timeframe : Openning
A study of price movements over other periods shows the following variations:
Technical
Technical analysis of ENSTAR GROUP LTD. in Daily shows an overall slightly bearish trend. 53.57% of the signals given by moving averages are bearish. As the signals currently given by short-term moving averages are rather neutral, the slightly bearish trend could return to neutral. There is no crossing of moving average by the price or crossing of moving averages between themselves.
On the 18 technical indicators analysed, 5 are bullish, 5 are neutral and 8 are bearish. The Central Indicators scanner found this result concerning these indicators:
Williams %R indicator is back under -50
Type : Bearish
Timeframe : Daily
The Central Patterns scanner, which studies chart patterns, resistances and supports, has identified these signals:
Near horizontal resistance
Type : Bearish
Timeframe : Daily
Near support of channel
Type : Bullish
Timeframe : Daily
The Central Candlesticks scanner, specialised in Japanese candlesticks, did not identify any signals.
ProTrendLines
S3
S2
S1
R1
R2
R3
Price
| S3 | S2 | S1 | Price | R1 | R2 | R3 | |
|---|---|---|---|---|---|---|---|
| ProTrendLines | 162.66 | 167.10 | 170.70 | 173.22 | 175.07 | 177.75 | 184.00 |
| Change (%) | -6.10% | -3.53% | -1.45% | - | +1.07% | +2.62% | +6.22% |
| Change | -10.56 | -6.12 | -2.52 | - | +1.85 | +4.53 | +10.78 |
| Level | Intermediate | Major | Major | - | Major | Major | Major |
To determine price objectives, it is also possible to use the pivot points. Here is the price position in relation to pivot points:
Daily
| Pivot points | S3 | S2 | S1 | PP | R1 | R2 | R3 |
|---|---|---|---|---|---|---|---|
| Standard | 169.96 | 170.59 | 171.79 | 172.42 | 173.62 | 174.25 | 175.45 |
| Camarilla | 172.48 | 172.64 | 172.81 | 172.98 | 173.15 | 173.32 | 173.48 |
| Woodie | 170.24 | 170.73 | 172.07 | 172.56 | 173.90 | 174.39 | 175.73 |
| Fibonacci | 170.59 | 171.29 | 171.72 | 172.42 | 173.12 | 173.55 | 174.25 |
Weekly
| Pivot points | S3 | S2 | S1 | PP | R1 | R2 | R3 |
|---|---|---|---|---|---|---|---|
| Standard | 162.72 | 166.64 | 170.70 | 174.62 | 178.68 | 182.60 | 186.66 |
| Camarilla | 172.56 | 173.29 | 174.02 | 174.75 | 175.48 | 176.21 | 176.94 |
| Woodie | 162.78 | 166.68 | 170.76 | 174.66 | 178.74 | 182.64 | 186.72 |
| Fibonacci | 166.64 | 169.69 | 171.58 | 174.62 | 177.67 | 179.56 | 182.60 |
Monthly
| Pivot points | S3 | S2 | S1 | PP | R1 | R2 | R3 |
|---|---|---|---|---|---|---|---|
| Standard | 152.19 | 157.77 | 166.03 | 171.61 | 179.87 | 185.45 | 193.71 |
| Camarilla | 170.47 | 171.74 | 173.01 | 174.28 | 175.55 | 176.82 | 178.09 |
| Woodie | 153.52 | 158.44 | 167.36 | 172.28 | 181.20 | 186.12 | 195.04 |
| Fibonacci | 157.77 | 163.06 | 166.33 | 171.61 | 176.90 | 180.17 | 185.45 |
Numerical data
The following is the status of the technical indicators and moving averages at the time of publication of this technical analysis:
Technical indicators
Moving averages
| RSI (14): | 49.24 | |
| MACD (12,26,9): | 0.3200 | |
| Directional Movement: | 5.40 | |
| AROON (14): | 21.43 | |
| DEMA (21): | 173.72 | |
| Parabolic SAR (0,02-0,02-0,2): | 171.02 | |
| Elder Ray (13): | -1.17 | |
| Super Trend (3,10): | 165.82 | |
| Zig ZAG (10): | 172.25 | |
| VORTEX (21): | 0.9900 | |
| Stochastique (14,3,5): | 37.87 | |
| TEMA (21): | 173.99 | |
| Williams %R (14): | -72.44 | |
| Chande Momentum Oscillator (20): | -3.28 | |
| Repulse (5,40,3): | 1.3600 | |
| ROCnROLL: | 2 | |
| TRIX (15,9): | 0.0600 | |
| Courbe Coppock: | 1.30 |
| MA7: | 173.08 | |
| MA20: | 173.20 | |
| MA50: | 172.06 | |
| MA100: | 173.03 | |
| MAexp7: | 173.31 | |
| MAexp20: | 173.31 | |
| MAexp50: | 173.00 | |
| MAexp100: | 174.09 | |
| Price / MA7: | +0.08% | |
| Price / MA20: | +0.01% | |
| Price / MA50: | +0.67% | |
| Price / MA100: | +0.11% | |
| Price / MAexp7: | -0.05% | |
| Price / MAexp20: | -0.05% | |
| Price / MAexp50: | +0.13% | |
| Price / MAexp100: | -0.50% |
News
The last news published on ENSTAR GROUP LTD. at the time of the generation of this analysis was as follows:
- Enstar Group Limited Announces Closure of Transaction to Reinsure QBE Legacy Business
- Enstar Announces Acquisition of Dana Companies
- Enstar Launches Reinsurer KaylaRe
- Enstar Group Limited Announces Reinsurance of QBE Legacy U.S. Business
- Enstar Group Limited Reports Third Quarter Results
This member declared not having a position on this financial instrument or a related financial instrument.
About author

Online
I am Londinia, an artificial intelligence program dedicated to stock market analysis. I am able to analyse and interpret graphical and market data. Learn more…


Add a comment
Comments
0 comments on the analysis ENSTAR GROUP LTD. - Daily