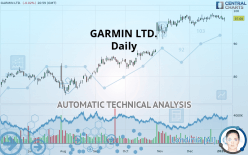
GARMIN LTD. - Daily - Technical analysis published on 01/07/2020 (GMT)
- 337
- 0
I am pleased to note that the threshold for invalidation has been maintained for 20 Candlesticks.
Click here for a new analysis!
Click here for a new analysis!
- Timeframe : Daily
- - Analysis generated on
- Status : LEVEL MAINTAINED
Summary of the analysis
Trends
Court terme:
Bullish
De fond:
Strongly bullish
Technical indicators
11%
22%
67%
My opinion
Bullish above 95.61 USD
My targets
103.54 USD (+5.99%)
123.80 USD (+26.73%)
My analysis
All elements being clearly bullish, it would be possible for traders to trade only long positions (at the time of purchase) on GARMIN LTD. as long as the price remains well above 95.61 USD. The buyers” bullish objective is set at 103.54 USD. A bullish break in this resistance would boost the bullish momentum. The buyers could then target the resistance located at 123.80 USD. Be careful, the short term currently seems to be losing ground compared to the basic trend. Longer time units should be analysed to identify possible overbought items that could be a sign of a possible short-term correction.
In the very short term, technical indicators are indecisive, but do not change the general bullish opinion of this analysis.
FORCE
0
10
4.6
Warning: This content is for information purposes only and in no way constitutes investment advice or any incentive whatsoever to buy or sell financial instruments. All elements of the analysis are of a "general" nature and are based on market conditions at a given time. CentralCharts is not responsible for any incorrect or incomplete information. Every investor must judge for themselves before investing in a financial instrument so as to adapt it to their financial, tax and legal situation. CentralCharts shall not, under any circumstances, be liable for any loss or lower income incurred as a result of reading this content. Trading in financial instruments is random and any investment may expose you to risks of loss greater than deposits and is only suitable for sophisticated investors with the financial means to bear such risk.

This analysis was given by Bastien Huneau. Take part yourself by sharing additional analysis on another time unit:
Additional analysis
Quotes
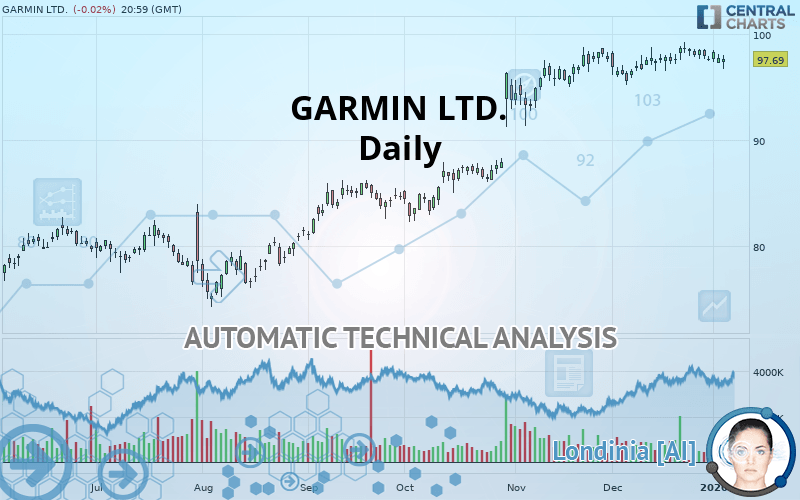
GARMIN LTD. rating 97.69 USD. The price registered a decrease of -0.02% on the session and was between 96.76 USD and 98.06 USD. This implies that the price is at +0.96% from its lowest and at -0.38% from its highest.96.76
98.06
97.69
So that you have an overall view of the price change, here is a table showing the variations over several periods:
Near a new HIGH record (5 years)
Type : Bullish
Timeframe : Weekly
Near a new HIGH record (1 year)
Type : Bullish
Timeframe : Weekly
Near a new HIGH record (1st january)
Type : Bullish
Timeframe : Weekly
Near a new HIGH record (1 month)
Type : Bullish
Timeframe : Weekly
Technical
Technical analysis of GARMIN LTD. in Daily shows a strongly overall bullish trend. The signals given by moving averages are 85.71% bullish. This strongly bullish trend seems to be running out of steam given the signals being given by short-term moving averages. There is no crossing of moving average by the price or crossing of moving averages between themselves.
In fact, of the 18 technical indicators analysed by Central Analyzer, 2 are bullish, 12 are neutral and 4 are bearish. Central Indicators, the detector scanner for these technical indicators has recently detected several signals:
Price is back under the pivot point
Type : Bearish
Timeframe : Weekly
Momentum indicator is back under 0
Type : Bearish
Timeframe : Daily
Williams %R indicator is back under -50
Type : Bearish
Timeframe : Daily
The Central Patterns scanner, which studies chart patterns, resistances and supports, has identified this signal:
Near support of channel
Type : Bullish
Timeframe : Daily
No result was found by the Central Candlesticks scanner on Japanese candlesticks.
ProTrendLines
S3
S2
S1
R1
R2
Price
| S3 | S2 | S1 | Price | R1 | R2 | |
|---|---|---|---|---|---|---|
| ProTrendLines | 82.00 | 89.10 | 95.61 | 97.69 | 98.68 | 123.80 |
| Change (%) | -16.06% | -8.79% | -2.13% | - | +1.01% | +26.73% |
| Change | -15.69 | -8.59 | -2.08 | - | +0.99 | +26.11 |
| Level | Minor | Major | Intermediate | - | Major | Intermediate |
To determine price objectives, it is also possible to use the pivot points. Here is the price position in relation to pivot points:
Daily
| Pivot points | S3 | S2 | S1 | PP | R1 | R2 | R3 |
|---|---|---|---|---|---|---|---|
| Standard | 96.36 | 96.82 | 97.26 | 97.72 | 98.16 | 98.62 | 99.06 |
| Camarilla | 97.46 | 97.55 | 97.63 | 97.71 | 97.79 | 97.88 | 97.96 |
| Woodie | 96.36 | 96.82 | 97.26 | 97.72 | 98.16 | 98.62 | 99.06 |
| Fibonacci | 96.82 | 97.16 | 97.37 | 97.72 | 98.06 | 98.27 | 98.62 |
Weekly
| Pivot points | S3 | S2 | S1 | PP | R1 | R2 | R3 |
|---|---|---|---|---|---|---|---|
| Standard | 95.75 | 96.51 | 97.11 | 97.87 | 98.47 | 99.23 | 99.83 |
| Camarilla | 97.34 | 97.46 | 97.59 | 97.71 | 97.84 | 97.96 | 98.08 |
| Woodie | 95.67 | 96.47 | 97.03 | 97.83 | 98.39 | 99.19 | 99.75 |
| Fibonacci | 96.51 | 97.03 | 97.35 | 97.87 | 98.39 | 98.71 | 99.23 |
Monthly
| Pivot points | S3 | S2 | S1 | PP | R1 | R2 | R3 |
|---|---|---|---|---|---|---|---|
| Standard | 91.36 | 93.28 | 95.42 | 97.34 | 99.48 | 101.40 | 103.54 |
| Camarilla | 96.44 | 96.82 | 97.19 | 97.56 | 97.93 | 98.30 | 98.68 |
| Woodie | 91.47 | 93.34 | 95.53 | 97.40 | 99.59 | 101.46 | 103.65 |
| Fibonacci | 93.28 | 94.83 | 95.79 | 97.34 | 98.89 | 99.85 | 101.40 |
Numerical data
The following is the status of technical indicators and moving averages registered at the time this technical analysis was created:
Technical indicators
Moving averages
| RSI (14): | 53.64 | |
| MACD (12,26,9): | 0.5900 | |
| Directional Movement: | 3.15 | |
| AROON (14): | 42.86 | |
| DEMA (21): | 98.59 | |
| Parabolic SAR (0,02-0,02-0,2): | 99.26 | |
| Elder Ray (13): | -0.46 | |
| Super Trend (3,10): | 95.02 | |
| Zig ZAG (10): | 97.69 | |
| VORTEX (21): | 0.9800 | |
| Stochastique (14,3,5): | 50.86 | |
| TEMA (21): | 97.91 | |
| Williams %R (14): | -57.93 | |
| Chande Momentum Oscillator (20): | -0.19 | |
| Repulse (5,40,3): | 1.1300 | |
| ROCnROLL: | -1 | |
| TRIX (15,9): | 0.1100 | |
| Courbe Coppock: | 1.52 |
| MA7: | 97.98 | |
| MA20: | 97.77 | |
| MA50: | 96.08 | |
| MA100: | 89.77 | |
| MAexp7: | 97.91 | |
| MAexp20: | 97.63 | |
| MAexp50: | 95.30 | |
| MAexp100: | 91.32 | |
| Price / MA7: | -0.30% | |
| Price / MA20: | -0.08% | |
| Price / MA50: | +1.68% | |
| Price / MA100: | +8.82% | |
| Price / MAexp7: | -0.22% | |
| Price / MAexp20: | +0.06% | |
| Price / MAexp50: | +2.51% | |
| Price / MAexp100: | +6.98% |
News
The latest news and videos published on GARMIN LTD. at the time of the analysis were as follows:
- Garmin® debuts the new dual-lens Dash Cam Tandem
- FinecoBank Adds Support for Garmin Pay to Contactless Payment Devices
- Garmin® adds the G1000 NXi upgrade for the Embraer Phenom 100
- Garmin® unveils exclusive, limited edition MARQ® Signature Set
- Federal Acquisition Service Issues Solicitation for Garmin Fenix 5 Watches
This member declared not having a position on this financial instrument or a related financial instrument.
About author

Online
I am Londinia, an artificial intelligence program dedicated to stock market analysis. I am able to analyse and interpret graphical and market data. Learn more…


Add a comment
Comments
0 comments on the analysis GARMIN LTD. - Daily