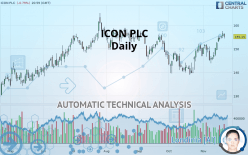
ICON PLC - Daily - Technical analysis published on 11/22/2019 (GMT)
- Who voted?
- 157
- 0
Click here for a new analysis!
- Timeframe : Daily
- - Analysis generated on
- Status : TARGET REACHED

Summary of the analysis

Additional analysis
Quotes
The ICON PLC rating is 155.15 USD. The price registered a decrease of -0.79% on the session and was traded between 154.28 USD and 156.55 USD over the period. The price is currently at +0.56% from its lowest and -0.89% from its highest.A bearish opening was detected by the Central Gaps scanner. Sellers are trying to impose a bearish trend in the very short term.
Bearish opening
Type : Bearish
Timeframe : Openning
Here is a more detailed summary of the historical variations registered by ICON PLC:
Near a new HIGH record (5 years)
Type : Bullish
Timeframe : Weekly
Near a new HIGH record (1 month)
Type : Bullish
Timeframe : Weekly
Technical
Technical analysis of ICON PLC in Daily shows a strongly overall bullish trend. 85.71% of the signals given by moving averages are bullish. This strongly bullish trend is supported by the strong bullish signals given by short-term moving averages. The Central Indicators market scanner is currently detecting several bullish signals that could impact this trend:
Moving Average bullish crossovers : AMA20 & AMA50
Type : Bullish
Timeframe : Daily
Moving Average bullish crossovers : AMA50 & AMA100
Type : Bullish
Timeframe : Daily
In fact, 13 technical indicators on 18 studied are currently bullish. But beware of excesses. The Central Indicators scanner currently detects this:
CCI indicator is overbought : over 100
Type : Neutral
Timeframe : Daily
Williams %R indicator is overbought : over -20
Type : Neutral
Timeframe : Daily
Price is back over the pivot point
Type : Bullish
Timeframe : Daily
Price is back over the pivot point
Type : Bullish
Timeframe : Weekly
Central Patterns, the market scanner focusing on chart patterns, resistances and supports found these results:
Near horizontal resistance
Type : Bearish
Timeframe : Daily
Resistance of channel is broken
Type : Bullish
Timeframe : Daily
The Central Candlesticks scanner, specialised in Japanese candlesticks, did not identify any signals.
| S3 | S2 | S1 | Price | R1 | R2 | |
|---|---|---|---|---|---|---|
| ProTrendLines | 139.49 | 146.92 | 153.75 | 155.15 | 157.30 | 161.41 |
| Change (%) | -10.09% | -5.30% | -0.90% | - | +1.39% | +4.03% |
| Change | -15.66 | -8.23 | -1.40 | - | +2.15 | +6.26 |
| Level | Intermediate | Major | Major | - | Intermediate | Major |
Attention could also be paid to pivot points to set price objectives:
| Pivot points | S3 | S2 | S1 | PP | R1 | R2 | R3 |
|---|---|---|---|---|---|---|---|
| Standard | 151.61 | 153.00 | 154.70 | 156.09 | 157.79 | 159.18 | 160.88 |
| Camarilla | 155.54 | 155.82 | 156.11 | 156.39 | 156.67 | 156.96 | 157.24 |
| Woodie | 151.76 | 153.08 | 154.85 | 156.17 | 157.94 | 159.26 | 161.03 |
| Fibonacci | 153.00 | 154.18 | 154.91 | 156.09 | 157.27 | 158.00 | 159.18 |
| Pivot points | S3 | S2 | S1 | PP | R1 | R2 | R3 |
|---|---|---|---|---|---|---|---|
| Standard | 137.55 | 141.33 | 147.96 | 151.74 | 158.37 | 162.15 | 168.78 |
| Camarilla | 151.73 | 152.68 | 153.64 | 154.59 | 155.54 | 156.50 | 157.45 |
| Woodie | 138.98 | 142.04 | 149.39 | 152.45 | 159.80 | 162.86 | 170.21 |
| Fibonacci | 141.33 | 145.31 | 147.76 | 151.74 | 155.72 | 158.17 | 162.15 |
| Pivot points | S3 | S2 | S1 | PP | R1 | R2 | R3 |
|---|---|---|---|---|---|---|---|
| Standard | 126.55 | 132.69 | 139.79 | 145.93 | 153.03 | 159.17 | 166.27 |
| Camarilla | 143.26 | 144.47 | 145.69 | 146.90 | 148.11 | 149.33 | 150.54 |
| Woodie | 127.04 | 132.93 | 140.28 | 146.17 | 153.52 | 159.41 | 166.76 |
| Fibonacci | 132.69 | 137.74 | 140.87 | 145.93 | 150.98 | 154.11 | 159.17 |
Numerical data
The following is the status of the technical indicators and moving averages at the time of publication of this technical analysis:
| RSI (14): | 62.23 | |
| MACD (12,26,9): | 2.2200 | |
| Directional Movement: | 12.33 | |
| AROON (14): | 57.15 | |
| DEMA (21): | 153.18 | |
| Parabolic SAR (0,02-0,02-0,2): | 146.46 | |
| Elder Ray (13): | 3.38 | |
| Super Trend (3,10): | 146.80 | |
| Zig ZAG (10): | 155.15 | |
| VORTEX (21): | 1.1700 | |
| Stochastique (14,3,5): | 90.89 | |
| TEMA (21): | 155.41 | |
| Williams %R (14): | -17.06 | |
| Chande Momentum Oscillator (20): | 5.62 | |
| Repulse (5,40,3): | 0.8000 | |
| ROCnROLL: | 1 | |
| TRIX (15,9): | 0.1400 | |
| Courbe Coppock: | 6.32 |
| MA7: | 154.04 | |
| MA20: | 150.54 | |
| MA50: | 148.04 | |
| MA100: | 151.08 | |
| MAexp7: | 153.83 | |
| MAexp20: | 150.73 | |
| MAexp50: | 149.34 | |
| MAexp100: | 148.61 | |
| Price / MA7: | +0.72% | |
| Price / MA20: | +3.06% | |
| Price / MA50: | +4.80% | |
| Price / MA100: | +2.69% | |
| Price / MAexp7: | +0.86% | |
| Price / MAexp20: | +2.93% | |
| Price / MAexp50: | +3.89% | |
| Price / MAexp100: | +4.40% |
News
The last news published on ICON PLC at the time of the generation of this analysis was as follows:
- ICON plc to Present at Baird's 2019 Global Healthcare Conference
- ICON Shareholders Vote in Favour of All Resolutions at its Annual General Meeting
- ICON Reports Fourth Quarter and Full Year 2018 Results
About author

Online


Add a comment
Comments
0 comments on the analysis ICON PLC - Daily