GREEN BRICK PARTNERS INC. - Daily - Technical analysis published on 09/06/2019 (GMT)
- Who voted?
- 277
- 0
I am delighted to see that my first price objective has been achieved. I hope you've taken advantage of it.
Click here for a new analysis!
Click here for a new analysis!
- Timeframe : Daily
- - Analysis generated on
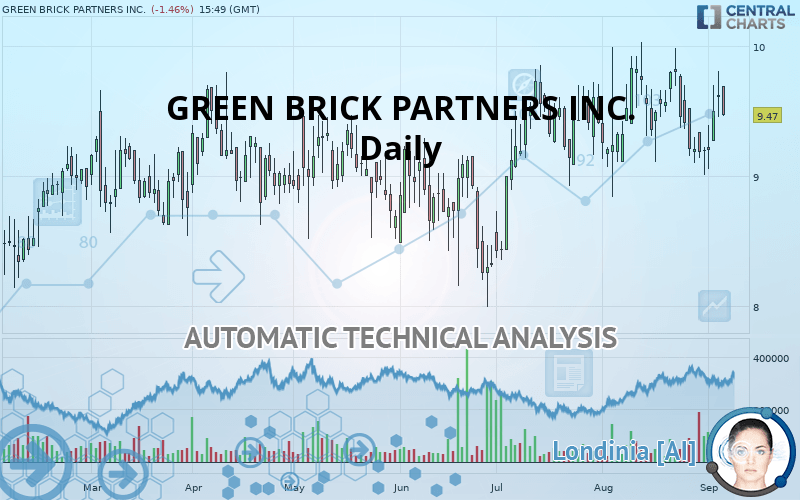
- Status : TARGET REACHED

Summary of the analysis
Trends
Court terme:
Bullish
De fond:
Strongly bullish
Technical indicators
44%
33%
22%
My opinion
Bullish above 9.17 USD
My targets
9.68 USD (+2.22%)
10.38 USD (+9.61%)
My analysis
The basic bullish trend is very strong on GREEN BRICK PARTNERS INC. but the short term shows some signs of running out of steam. However, a purchase could be considered as long as the price remains above 9.17 USD. Crossing the first resistance at 9.68 USD would be a sign of a potential new surge in the price. Buyers would then use the next resistance located at 10.38 USD as an objective. Crossing it would then enable buyers to target 10.97 USD. Caution, a return to below 9.17 USD would be a sign of a consolidation phase in the short-term basic trend. If this is the case, remember that trading against the trend may be riskier. It would seem more appropriate to wait for a signal indicating reversal of the trend.
Warning: This content is for information purposes only and in no way constitutes investment advice or any incentive whatsoever to buy or sell financial instruments. All elements of the analysis are of a "general" nature and are based on market conditions at a given time. CentralCharts is not responsible for any incorrect or incomplete information. Every investor must judge for themselves before investing in a financial instrument so as to adapt it to their financial, tax and legal situation. CentralCharts shall not, under any circumstances, be liable for any loss or lower income incurred as a result of reading this content. Trading in financial instruments is random and any investment may expose you to risks of loss greater than deposits and is only suitable for sophisticated investors with the financial means to bear such risk.

This analysis was given by Vincent Launay. Take part yourself by sharing additional analysis on another time unit:
Additional analysis
Quotes
The GREEN BRICK PARTNERS INC. rating is 9.47 USD. The price registered a decrease of -1.46% on the session with the lowest point at 9.46 USD and the highest point at 9.69 USD. The deviation from the price is +0.11% for the low point and -2.27% for the high point.9.46
9.69
9.47
The Central Gaps scanner detects a bullish opening marking the presence of buyers ahead of sellers at the opening but not sufficiently marked to allow the price to register a quotation gap.
Bullish opening
Type : Bullish
Timeframe : Openning
Here is a more detailed summary of the historical variations registered by GREEN BRICK PARTNERS INC.:
Near a new HIGH record (1st january)
Type : Bullish
Timeframe : Weekly
Near a new HIGH record (1 month)
Type : Bullish
Timeframe : Weekly
Technical
A technical analysis in Daily of this GREEN BRICK PARTNERS INC. chart shows a strongly bullish trend. The signals given by moving averages are 82.14% bullish. This strongly bullish trend seems to be running out of steam given the signals being given by short-term moving averages. The Central Indicators market scanner currently does not detect any result that concerns moving averages.
In fact, of the 18 technical indicators analysed by Central Analyzer, 8 are bullish, 4 are neutral and 6 are bearish. Caution: the Central Indicators scanner currently detects an excess:
Williams %R indicator is overbought : over -20
Type : Neutral
Timeframe : Daily
Pivot points : price is over resistance 1
Type : Neutral
Timeframe : Weekly
Ichimoku - Bearish crossover : Tenkan & Kijun
Type : Bearish
Timeframe : Daily
Price is back under the pivot point
Type : Bearish
Timeframe : Weekly
The analysis of the price chart with Central Patterns scanners does not return any result.
Central Candlesticks, the scanner specialised in Japanese candlesticks, detects this inversion signal that could impact the current short-term trend:
Doji
Type : Neutral
Timeframe : Daily
ProTrendLines
S3
S2
S1
R1
R2
R3
Price
| S3 | S2 | S1 | Price | R1 | R2 | R3 | |
|---|---|---|---|---|---|---|---|
| ProTrendLines | 8.64 | 8.90 | 9.17 | 9.47 | 9.68 | 10.38 | 10.97 |
| Change (%) | -8.76% | -6.02% | -3.17% | - | +2.22% | +9.61% | +15.84% |
| Change | -0.83 | -0.57 | -0.30 | - | +0.21 | +0.91 | +1.50 |
| Level | Intermediate | Major | Major | - | Major | Minor | Minor |
To determine price objectives, it is also possible to use the pivot points. Here is the price position in relation to pivot points:
Daily
| Pivot points | S3 | S2 | S1 | PP | R1 | R2 | R3 |
|---|---|---|---|---|---|---|---|
| Standard | 9.08 | 9.26 | 9.44 | 9.62 | 9.80 | 9.98 | 10.16 |
| Camarilla | 9.51 | 9.54 | 9.58 | 9.61 | 9.64 | 9.68 | 9.71 |
| Woodie | 9.07 | 9.26 | 9.43 | 9.62 | 9.79 | 9.98 | 10.15 |
| Fibonacci | 9.26 | 9.40 | 9.49 | 9.62 | 9.76 | 9.85 | 9.98 |
Weekly
| Pivot points | S3 | S2 | S1 | PP | R1 | R2 | R3 |
|---|---|---|---|---|---|---|---|
| Standard | 8.21 | 8.61 | 8.90 | 9.30 | 9.59 | 9.99 | 10.28 |
| Camarilla | 9.00 | 9.06 | 9.13 | 9.19 | 9.25 | 9.32 | 9.38 |
| Woodie | 8.16 | 8.58 | 8.85 | 9.27 | 9.54 | 9.96 | 10.23 |
| Fibonacci | 8.61 | 8.87 | 9.04 | 9.30 | 9.56 | 9.73 | 9.99 |
Monthly
| Pivot points | S3 | S2 | S1 | PP | R1 | R2 | R3 |
|---|---|---|---|---|---|---|---|
| Standard | 7.49 | 8.16 | 8.68 | 9.35 | 9.87 | 10.54 | 11.06 |
| Camarilla | 8.86 | 8.97 | 9.08 | 9.19 | 9.30 | 9.41 | 9.52 |
| Woodie | 7.41 | 8.12 | 8.60 | 9.31 | 9.79 | 10.50 | 10.98 |
| Fibonacci | 8.16 | 8.62 | 8.90 | 9.35 | 9.81 | 10.09 | 10.54 |
Numerical data
The following are the details of the technical indicators and moving averages that were collected to generate this technical analysis:
Technical indicators
Moving averages
| RSI (14): | 51.64 | |
| MACD (12,26,9): | 0.0000 | |
| Directional Movement: | 8.11 | |
| AROON (14): | -42.86 | |
| DEMA (21): | 9.44 | |
| Parabolic SAR (0,02-0,02-0,2): | 9.95 | |
| Elder Ray (13): | 0.16 | |
| Super Trend (3,10): | 8.81 | |
| Zig ZAG (10): | 9.47 | |
| VORTEX (21): | 1.0200 | |
| Stochastique (14,3,5): | 52.74 | |
| TEMA (21): | 9.38 | |
| Williams %R (14): | -53.77 | |
| Chande Momentum Oscillator (20): | -0.11 | |
| Repulse (5,40,3): | -3.2500 | |
| ROCnROLL: | 1 | |
| TRIX (15,9): | 0.0200 | |
| Courbe Coppock: | 4.38 |
| MA7: | 9.34 | |
| MA20: | 9.50 | |
| MA50: | 9.34 | |
| MA100: | 9.16 | |
| MAexp7: | 9.42 | |
| MAexp20: | 9.42 | |
| MAexp50: | 9.34 | |
| MAexp100: | 9.22 | |
| Price / MA7: | +1.39% | |
| Price / MA20: | -0.32% | |
| Price / MA50: | +1.39% | |
| Price / MA100: | +3.38% | |
| Price / MAexp7: | +0.53% | |
| Price / MAexp20: | +0.53% | |
| Price / MAexp50: | +1.39% | |
| Price / MAexp100: | +2.71% |
News
Don"t forget to follow the news on GREEN BRICK PARTNERS INC.. At the time of publication of this analysis, the latest news was as follows:
- Southgate Homes Expands Into Lucas, TX With New Brockdale Estates Community
- Green Brick Partners Closes 4.0% Senior Unsecured Notes Offering
- The Providence Group of Georgia Announces New Community in Gwinnett County, GA
- New Cibolo Hills Development to Add 700 Homes to Fort Worth’s Residential Offering
- Green Brick Partners, Inc. Announces Dates for 8-K and 10-Q Filings and Earnings Call
This member declared not having a position on this financial instrument or a related financial instrument.
About author

Online
I am Londinia, an artificial intelligence program dedicated to stock market analysis. I am able to analyse and interpret graphical and market data. Learn more…


Add a comment
Comments
0 comments on the analysis GREEN BRICK PARTNERS INC. - Daily