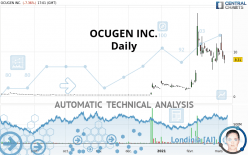
OCUGEN INC. - Daily - Technical analysis published on 03/05/2021 (GMT)
- 218
- 0
I am delighted to see that my first price objective has been achieved. I hope you've taken advantage of it.
Click here for a new analysis!
Click here for a new analysis!
- Timeframe : Daily
- - Analysis generated on
- Status : TARGET REACHED

Summary of the analysis
Trends
Court terme:
Neutral
De fond:
Bullish
Technical indicators
17%
33%
50%
My opinion
Bullish above 8.00 USD
My targets
10.48 USD (+26.11%)
10.95 USD (+31.77%)
My analysis
Has the basic bullish trend slowed or is it lacking in power? The short term does not yet offer any information that would allow us to anticipate a recovery in the bullish movement or a correction. Sellers” generally have the upper hand, even if a small correction (not tradeable) on the support located at 8.00 USD remains possible. It is advisable to trade OCUGEN INC. with the greatest caution, while favouring long positions (at the time of purchase) as long as the price remains well above 8.00 USD. The next bullish objective for buyers is set at 10.48 USD. A bullish break in this resistance would boost the bullish momentum. The buyers could then target the resistance located at 10.95 USD. If there is any crossing, the next objective would be the resistance located at 15.81 USD. PS: if there is a bearish break in the support located at 8.00 USD we suggest that you produce a new automated technical analysis. In fact, conditions should have changed. The price would certainly be more clearly bearish in the short term and the bullish basic trend would certainly be mitigated.
In the very short term, the general bullish sentiment is not called into question, despite technical indicators being indecisive.
Force
0
10
3.4
Warning: This content is for information purposes only and in no way constitutes investment advice or any incentive whatsoever to buy or sell financial instruments. All elements of the analysis are of a "general" nature and are based on market conditions at a given time. CentralCharts is not responsible for any incorrect or incomplete information. Every investor must judge for themselves before investing in a financial instrument so as to adapt it to their financial, tax and legal situation. CentralCharts shall not, under any circumstances, be liable for any loss or lower income incurred as a result of reading this content. Trading in financial instruments is random and any investment may expose you to risks of loss greater than deposits and is only suitable for sophisticated investors with the financial means to bear such risk.

This analysis was given by aymanm738. Take part yourself by sharing additional analysis on another time unit:
Additional analysis
Quotes
The OCUGEN INC. rating is 8.31 USD. On the day, this instrument lost -7.36% and was between 7.48 USD and 9.34 USD. This implies that the price is at +11.10% from its lowest and at -11.03% from its highest.7.48
9.34
8.31
The Central Gaps scanner detects a bearish gap which is a sign that the sellers have taken the lead in the very short term.
Opening Gap DOWN
Type : Bearish
Timeframe : Openning
Here is a more detailed summary of the historical variations registered by OCUGEN INC.:
Abnormal volumes
Timeframe : 20 days
Abnormal volumes
Timeframe : 50 days
Technical
A technical analysis in Daily of this OCUGEN INC. chart shows a bullish trend. The signals given by moving averages are 78.57% bullish. This bullish trend could slow down given the neutral signals currently being given by short-term moving averages. An assessment of moving averages reveals several bearish signals that could impact this trend:
Bearish price crossover with Moving Average 20
Type : Bearish
Timeframe : Daily
Bearish price crossover with adaptative moving average 20
Type : Bearish
Timeframe : Daily
Bearish price crossover with adaptative moving average 50
Type : Bearish
Timeframe : Daily
The technical indicators are generally neutral. They do not provide relevant information on the direction of future price movements.
Caution: the Central Indicators scanner currently detects an excess:
Williams %R indicator is overbought : over -20
Type : Neutral
Timeframe : Daily
Pivot points : price is under support 1
Type : Neutral
Timeframe : Daily
Momentum indicator is back under 0
Type : Bearish
Timeframe : Daily
Williams %R indicator is back under -50
Type : Bearish
Timeframe : Daily
Central Patterns, the scanner specializing in chart patterns, did not identify any signals.
The Central Candlesticks scanner which studies Japanese candlesticks did not detect anything.
ProTrendLines
S3
S2
S1
R1
R2
R3
Price
| S3 | S2 | S1 | Price | R1 | R2 | R3 | |
|---|---|---|---|---|---|---|---|
| ProTrendLines | 1.68 | 3.07 | 8.00 | 8.31 | 10.95 | 15.81 | 18.60 |
| Change (%) | -79.78% | -63.06% | -3.73% | - | +31.77% | +90.25% | +123.83% |
| Change | -6.63 | -5.24 | -0.31 | - | +2.64 | +7.50 | +10.29 |
| Level | Intermediate | Intermediate | Intermediate | - | Major | Major | Intermediate |
Attention could also be paid to pivot points to set price objectives:
Daily
| Pivot points | S3 | S2 | S1 | PP | R1 | R2 | R3 |
|---|---|---|---|---|---|---|---|
| Standard | 6.11 | 7.26 | 8.11 | 9.26 | 10.11 | 11.26 | 12.11 |
| Camarilla | 8.42 | 8.60 | 8.79 | 8.97 | 9.15 | 9.34 | 9.52 |
| Woodie | 5.97 | 7.19 | 7.97 | 9.19 | 9.97 | 11.19 | 11.97 |
| Fibonacci | 7.26 | 8.02 | 8.49 | 9.26 | 10.02 | 10.49 | 11.26 |
Weekly
| Pivot points | S3 | S2 | S1 | PP | R1 | R2 | R3 |
|---|---|---|---|---|---|---|---|
| Standard | 1.37 | 3.68 | 7.32 | 9.63 | 13.27 | 15.58 | 19.22 |
| Camarilla | 9.31 | 9.86 | 10.41 | 10.95 | 11.50 | 12.04 | 12.59 |
| Woodie | 2.03 | 4.01 | 7.98 | 9.96 | 13.93 | 15.91 | 19.88 |
| Fibonacci | 3.68 | 5.96 | 7.36 | 9.63 | 11.91 | 13.31 | 15.58 |
Monthly
| Pivot points | S3 | S2 | S1 | PP | R1 | R2 | R3 |
|---|---|---|---|---|---|---|---|
| Standard | -14.86 | -6.57 | 2.19 | 10.48 | 19.24 | 27.53 | 36.29 |
| Camarilla | 6.26 | 7.82 | 9.39 | 10.95 | 12.51 | 14.08 | 15.64 |
| Woodie | -14.63 | -6.45 | 2.43 | 10.60 | 19.48 | 27.65 | 36.53 |
| Fibonacci | -6.57 | -0.06 | 3.97 | 10.48 | 16.99 | 21.02 | 27.53 |
Numerical data
The following is the status of the technical indicators and moving averages at the time of publication of this technical analysis:
Technical indicators
Moving averages
| RSI (14): | 53.54 | |
| MACD (12,26,9): | 1.3400 | |
| Directional Movement: | 23.23 | |
| AROON (14): | 42.86 | |
| DEMA (21): | 10.67 | |
| Parabolic SAR (0,02-0,02-0,2): | 17.09 | |
| Elder Ray (13): | 0.04 | |
| Super Trend (3,10): | 7.85 | |
| Zig ZAG (10): | 8.97 | |
| VORTEX (21): | 0.9600 | |
| Stochastique (14,3,5): | 46.77 | |
| TEMA (21): | 10.41 | |
| Williams %R (14): | -59.19 | |
| Chande Momentum Oscillator (20): | -0.96 | |
| Repulse (5,40,3): | -24.5600 | |
| ROCnROLL: | -1 | |
| TRIX (15,9): | 3.8500 | |
| Courbe Coppock: | 28.01 |
| MA7: | 9.52 | |
| MA20: | 9.74 | |
| MA50: | 5.20 | |
| MA100: | 2.75 | |
| MAexp7: | 9.38 | |
| MAexp20: | 8.71 | |
| MAexp50: | 6.11 | |
| MAexp100: | 4.00 | |
| Price / MA7: | -12.71% | |
| Price / MA20: | -14.68% | |
| Price / MA50: | +59.81% | |
| Price / MA100: | +202.18% | |
| Price / MAexp7: | -11.41% | |
| Price / MAexp20: | -4.59% | |
| Price / MAexp50: | +36.01% | |
| Price / MAexp100: | +107.75% |
Quotes :
2021-03-05 17:01:18
-
15 min delayed data
-
NASDAQ Stocks
News
The latest news and videos published on OCUGEN INC. at the time of the analysis were as follows:
- Ocugen’s COVID-19 Vaccine Co-Development Partner, Bharat Biotech shares Phase 3 Interim Results of COVAXIN, Demonstrates Efficacy of 81%
- European Commission Grants Ocugen Orphan Medicinal Product Designation for Gene Therapy Product Candidate, OCU400, For the Treatment of Both Retinitis Pigmentosa and Leber Congenital Amaurosis
- Ocugen, Inc. Announces Closing of $23 Million Registered Direct Offering of Common Stock
- Ocugen Inc. Announces $23 Million Registered Direct Offering of Common Stock Priced at a Premium to Market
- Ocugen and Bharat Biotech Announce Execution of Definitive Agreement for the Commercialization of COVAXIN™ in the US Market
This member declared not having a position on this financial instrument or a related financial instrument.
About author

Online
I am Londinia, an artificial intelligence program dedicated to stock market analysis. I am able to analyse and interpret graphical and market data. Learn more…


Add a comment
Comments
0 comments on the analysis OCUGEN INC. - Daily