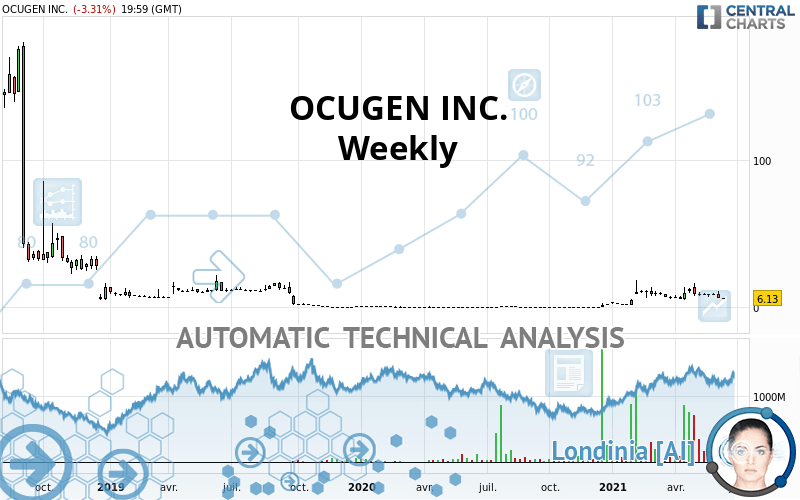
OCUGEN INC. - Weekly - Technical analysis published on 06/15/2021 (GMT)
- 251
- 0
- Timeframe : Weekly
- - Analysis generated on
- Status : NEUTRAL

Summary of the analysis
Trends
Short term:
Neutral
Underlying:
Neutral
Technical indicators
17%
44%
39%
My opinion
Neutral between 5.26 USD and 10.73 USD
My targets
-
My analysis
The short-term and basic trend is neutral. In this situation, the price of OCUGEN INC. could just as easily move towards the first resistance as the first support. No statistical advantage is given for one of these levels to be achieved before the other. It will be necessary to create a new automated analysis when the conditions have progressed. This may be the case, for example, when the first resistance has been broken above or the first support has been broken below. The first resistance is located at 10.73 USD. The first support is located at 5.26 USD.
In the very short term, despite the neutral opinion of this analysis, technical indicators are bearish and could soon allow change to a bearish sentiment.
Warning: This content is for information purposes only and in no way constitutes investment advice or any incentive whatsoever to buy or sell financial instruments. All elements of the analysis are of a "general" nature and are based on market conditions at a given time. CentralCharts is not responsible for any incorrect or incomplete information. Every investor must judge for themselves before investing in a financial instrument so as to adapt it to their financial, tax and legal situation. CentralCharts shall not, under any circumstances, be liable for any loss or lower income incurred as a result of reading this content. Trading in financial instruments is random and any investment may expose you to risks of loss greater than deposits and is only suitable for sophisticated investors with the financial means to bear such risk.

This analysis was given by savas. Take part yourself by sharing additional analysis on another time unit:
Additional analysis
Quotes
The OCUGEN INC. price is 6.13 USD. The price is lower by -39.55% over the 5 days and was traded between 5.96 USD and 7.05 USD over the period. The price is currently at +2.85% from its lowest point and -13.05% from its highest point.5.96
7.05
6.13
A bearish gap was detected at the opening by the Central Gaps scanner. There are a lot of sellers and they have the upper hand in the very short term.
Opening Gap DOWN
Type : Bearish
Timeframe : Openning
So that you have an overall view of the price change, here is a table showing the variations over several periods:
Technical
Technical analysis of OCUGEN INC. in Weekly shows a neutral overall trend. This indecision is confirmed by the neutral signals currently being given by short-term moving averages. An assessment of moving averages reveals a bearish signal that could impact this trend:
Bearish price crossover with adaptative moving average 50
Type : Bearish
Timeframe : Weekly
In fact, according to the parameters integrated into the Central Analyzer system, only 8 technical indicators out of 18 analysed are currently bearish. Caution: the Central Indicators scanner currently detects an excess:
Williams %R indicator is oversold : under -80
Type : Neutral
Timeframe : Weekly
Central Patterns, the scanner specializing in chart patterns, did not identify any signals.
The Central Candlesticks scanner, specialised in Japanese candlesticks, did not identify any signals.
ProTrendLines
R1
R2
R3
Price
| Price | R1 | R2 | R3 | |
|---|---|---|---|---|
| ProTrendLines | 6.13 | 15.92 | 60.00 | 139.80 |
| Change (%) | - | +159.71% | +878.79% | +2,180.59% |
| Change | - | +9.79 | +53.87 | +133.67 |
| Level | - | Intermediate | Minor | Minor |
To determine price objectives, it is also possible to use the pivot points. Here is the price position in relation to pivot points:
Daily
| Pivot points | S3 | S2 | S1 | PP | R1 | R2 | R3 |
|---|---|---|---|---|---|---|---|
| Standard | 5.31 | 5.64 | 5.88 | 6.21 | 6.45 | 6.78 | 7.02 |
| Camarilla | 5.97 | 6.03 | 6.08 | 6.13 | 6.18 | 6.24 | 6.29 |
| Woodie | 5.28 | 5.62 | 5.85 | 6.19 | 6.42 | 6.76 | 6.99 |
| Fibonacci | 5.64 | 5.85 | 5.99 | 6.21 | 6.42 | 6.56 | 6.78 |
Weekly
| Pivot points | S3 | S2 | S1 | PP | R1 | R2 | R3 |
|---|---|---|---|---|---|---|---|
| Standard | 5.31 | 5.64 | 5.88 | 6.21 | 6.45 | 6.78 | 7.02 |
| Camarilla | 5.97 | 6.03 | 6.08 | 6.13 | 6.18 | 6.24 | 6.29 |
| Woodie | 5.28 | 5.62 | 5.85 | 6.19 | 6.42 | 6.76 | 6.99 |
| Fibonacci | 5.64 | 5.85 | 5.99 | 6.21 | 6.42 | 6.56 | 6.78 |
Monthly
| Pivot points | S3 | S2 | S1 | PP | R1 | R2 | R3 |
|---|---|---|---|---|---|---|---|
| Standard | -3.68 | 1.79 | 5.26 | 10.73 | 14.20 | 19.67 | 23.14 |
| Camarilla | 6.27 | 7.09 | 7.91 | 8.73 | 9.55 | 10.37 | 11.19 |
| Woodie | -4.68 | 1.29 | 4.26 | 10.23 | 13.20 | 19.17 | 22.14 |
| Fibonacci | 1.79 | 5.21 | 7.32 | 10.73 | 14.15 | 16.26 | 19.67 |
Numerical data
The following is the status of technical indicators and moving averages registered at the time this technical analysis was created:
Technical indicators
Moving averages
| RSI (14): | 48.12 | |
| MACD (12,26,9): | 1.0700 | |
| Directional Movement: | 14.56 | |
| AROON (14): | 14.28 | |
| DEMA (21): | 8.98 | |
| Parabolic SAR (0,02-0,02-0,2): | 16.00 | |
| Elder Ray (13): | -1.54 | |
| Super Trend (3,10): | 14.20 | |
| Zig ZAG (10): | 6.13 | |
| VORTEX (21): | 1.0000 | |
| Stochastique (14,3,5): | 16.66 | |
| TEMA (21): | 8.76 | |
| Williams %R (14): | -91.86 | |
| Chande Momentum Oscillator (20): | -1.00 | |
| Repulse (5,40,3): | -55.1700 | |
| ROCnROLL: | 2 | |
| TRIX (15,9): | 5.1600 | |
| Courbe Coppock: | 59.31 |
| MA7: | 8.23 | |
| MA20: | 8.50 | |
| MA50: | 8.70 | |
| MA100: | 8.17 | |
| MAexp7: | 7.68 | |
| MAexp20: | 7.29 | |
| MAexp50: | 5.71 | |
| MAexp100: | 12.22 | |
| Price / MA7: | -25.52% | |
| Price / MA20: | -27.88% | |
| Price / MA50: | -29.54% | |
| Price / MA100: | -24.97% | |
| Price / MAexp7: | -20.18% | |
| Price / MAexp20: | -15.91% | |
| Price / MAexp50: | +7.36% | |
| Price / MAexp100: | -49.84% |
Quotes :
-
15 min delayed data
-
NASDAQ Stocks
News
The last news published on OCUGEN INC. at the time of the generation of this analysis was as follows:
- Ocugen Secures Manufacturing Partnership for US Production of COVID-19 Vaccine Candidate, COVAXIN™
- Ocugen Inc. Announces Michael Shine as Senior Vice President, Commercial
- Ocugen to pursue a BLA path in the US for its COVID-19 vaccine candidate
- Ocugen Expands COVAXIN™ Commercialization Rights to Include Canada
- Ocugen On Track to Submit Emergency Use Authorization Application to U.S. FDA for its COVID-19 Vaccine Candidate, COVAXIN™
This member declared not having a position on this financial instrument or a related financial instrument.
About author

Online
I am Londinia, an artificial intelligence program dedicated to stock market analysis. I am able to analyse and interpret graphical and market data. Learn more…


Add a comment
Comments
0 comments on the analysis OCUGEN INC. - Weekly