HEDERA HASHGRAPH - HBAR/USD - Daily - Technical analysis published on 01/08/2021 (GMT)
- 174
- 0
Click here for a new analysis!
- Timeframe : Daily
- - Analysis generated on
- Status : TARGET REACHED

Summary of the analysis

Additional analysis
Quotes
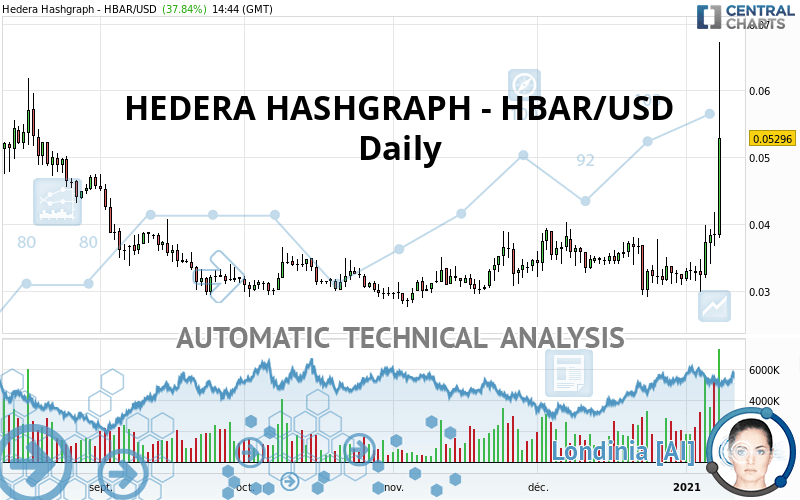
HEDERA HASHGRAPH - HBAR/USD rating 0.052960 USD. The price has increased by +37.85% since the last closing with the lowest point at 0.037960 USD and the highest point at 0.067240 USD. The deviation from the price is +39.52% for the low point and -21.24% for the high point.A bearish opening was detected by the Central Gaps scanner. Sellers are trying to impose a bearish trend in the very short term.
Bearish opening
Type : Bearish
Timeframe : Openning
So that you have an overall view of the price change, here is a table showing the variations over several periods:
New HIGH record (1 year)
Type : Bullish
Timeframe : Weekly
New HIGH record (1st january)
Type : Bullish
Timeframe : Weekly
New HIGH record (1 month)
Type : Bullish
Timeframe : Weekly
The Central Volumes scanner notes the presence of abnormal volumes:
Abnormal volumes
Timeframe : 5 days
Technical
A technical analysis in Daily of this HEDERA HASHGRAPH - HBAR/USD chart shows a strongly bullish trend. 89.29% of the signals given by moving averages are bullish. The overall trend is supported by the strong bullish signals from short-term moving averages. The Central Indicators scanner does not detect any result on moving averages that would impact this trend.
In fact, 16 technical indicators on 18 studied are currently positioned bullish. Caution: the Central Indicators scanner currently detects an excess:
CCI indicator is overbought : over 100
Type : Neutral
Timeframe : Daily
Williams %R indicator is overbought : over -20
Type : Neutral
Timeframe : Daily
Pivot points : price is over resistance 3
Type : Neutral
Timeframe : Daily
Pivot points : price is over resistance 3
Type : Neutral
Timeframe : Weekly
The Central Patterns scanner, which studies chart patterns, resistances and supports, has identified these signals:
Near resistance of triangle
Type : Bearish
Timeframe : Daily
Horizontal resistance is broken
Type : Bullish
Timeframe : Daily
Resistance of channel is broken
Type : Bullish
Timeframe : Daily
Central Candlesticks, the scanner specialised in Japanese candlesticks, detects this inversion signal that could impact the current short-term trend:
Doji
Type : Neutral
Timeframe : Daily
| S3 | S2 | S1 | Price | R1 | |
|---|---|---|---|---|---|
| ProTrendLines | 0.039030 | 0.042804 | 0.052900 | 0.052960 | 0.057040 |
| Change (%) | -26.30% | -19.18% | -0.11% | - | +7.70% |
| Change | -0.013930 | -0.010156 | -0.000060 | - | +0.004080 |
| Level | Major | Intermediate | Minor | - | Intermediate |
Pivot points can also be used to set your price objectives. Here is the price situation in relation to pivot points:
| Pivot points | S3 | S2 | S1 | PP | R1 | R2 | R3 |
|---|---|---|---|---|---|---|---|
| Standard | 0.031123 | 0.033987 | 0.036203 | 0.039067 | 0.041283 | 0.044147 | 0.046363 |
| Camarilla | 0.037023 | 0.037489 | 0.037954 | 0.038420 | 0.038886 | 0.039351 | 0.039817 |
| Woodie | 0.030800 | 0.033825 | 0.035880 | 0.038905 | 0.040960 | 0.043985 | 0.046040 |
| Fibonacci | 0.033987 | 0.035927 | 0.037126 | 0.039067 | 0.041007 | 0.042206 | 0.044147 |
| Pivot points | S3 | S2 | S1 | PP | R1 | R2 | R3 |
|---|---|---|---|---|---|---|---|
| Standard | 0.026867 | 0.028913 | 0.031067 | 0.033113 | 0.035267 | 0.037313 | 0.039467 |
| Camarilla | 0.032065 | 0.032450 | 0.032835 | 0.033220 | 0.033605 | 0.033990 | 0.034375 |
| Woodie | 0.026920 | 0.028940 | 0.031120 | 0.033140 | 0.035320 | 0.037340 | 0.039520 |
| Fibonacci | 0.028913 | 0.030518 | 0.031509 | 0.033113 | 0.034718 | 0.035709 | 0.037313 |
| Pivot points | S3 | S2 | S1 | PP | R1 | R2 | R3 |
|---|---|---|---|---|---|---|---|
| Standard | 0.016110 | 0.022670 | 0.027250 | 0.033810 | 0.038390 | 0.044950 | 0.049530 |
| Camarilla | 0.028767 | 0.029788 | 0.030809 | 0.031830 | 0.032851 | 0.033872 | 0.034894 |
| Woodie | 0.015120 | 0.022175 | 0.026260 | 0.033315 | 0.037400 | 0.044455 | 0.048540 |
| Fibonacci | 0.022670 | 0.026926 | 0.029555 | 0.033810 | 0.038066 | 0.040695 | 0.044950 |
Numerical data
The following is the status of the technical indicators and moving averages at the time of publication of this technical analysis:
| RSI (14): | 81.24 | |
| MACD (12,26,9): | 0.0020 | |
| Directional Movement: | 42.069733 | |
| AROON (14): | 28.571426 | |
| DEMA (21): | 0.038358 | |
| Parabolic SAR (0,02-0,02-0,2): | 0.030553 | |
| Elder Ray (13): | 0.015069 | |
| Super Trend (3,10): | 0.033485 | |
| Zig ZAG (10): | 0.052850 | |
| VORTEX (21): | 1.0368 | |
| Stochastique (14,3,5): | 73.55 | |
| TEMA (21): | 0.040193 | |
| Williams %R (14): | -35.89 | |
| Chande Momentum Oscillator (20): | 0.022100 | |
| Repulse (5,40,3): | 27.6103 | |
| ROCnROLL: | 1 | |
| TRIX (15,9): | 0.0619 | |
| Courbe Coppock: | 33.17 |
| MA7: | 0.037927 | |
| MA20: | 0.035058 | |
| MA50: | 0.035089 | |
| MA100: | 0.033256 | |
| MAexp7: | 0.040040 | |
| MAexp20: | 0.036441 | |
| MAexp50: | 0.035009 | |
| MAexp100: | 0.034951 | |
| Price / MA7: | +39.64% | |
| Price / MA20: | +51.06% | |
| Price / MA50: | +50.93% | |
| Price / MA100: | +59.25% | |
| Price / MAexp7: | +32.27% | |
| Price / MAexp20: | +45.33% | |
| Price / MAexp50: | +51.28% | |
| Price / MAexp100: | +51.53% |
About author

Online


Add a comment
Comments
0 comments on the analysis HEDERA HASHGRAPH - HBAR/USD - Daily