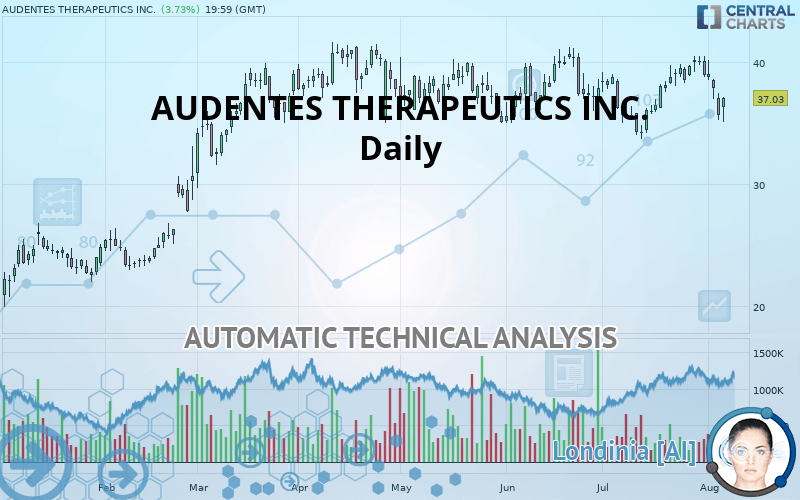
AUDENTES THERAPEUTICS INC. - Daily - Technical analysis published on 08/07/2019 (GMT)
- Who voted?
- 150
- 0
Click here for a new analysis!
- Timeframe : Daily
- - Analysis generated on
- Status : TARGET REACHED
Summary of the analysis
Additional analysis
Quotes
The AUDENTES THERAPEUTICS INC. rating is 37.03 USD. The price registered an increase of +3.73% on the session with the lowest point at 35.05 USD and the highest point at 37.15 USD. The deviation from the price is +5.65% for the low point and -0.32% for the high point.The Central Gaps scanner detects a bullish opening marking the presence of buyers ahead of sellers at the opening but not sufficiently marked to allow the price to register a quotation gap.
Bullish opening
Type : Bullish
Timeframe : Openning
Here is a more detailed summary of the historical variations registered by AUDENTES THERAPEUTICS INC.:
Near a new LOW record (1 month)
Type : Bearish
Timeframe : Weekly
Technical
Technical analysis of AUDENTES THERAPEUTICS INC. in Daily shows an overall slightly bearish trend. Only 53.57% of the signals given by moving averages are bearish. This slightly bearish trend is not supported by the signals currently being given by short-term moving averages. The Central Indicators scanner detects bearish signals on moving averages that could impact this trend:
Bearish trend reversal : adaptative moving average 50
Type : Bearish
Timeframe : Daily
Bearish price crossover with Moving Average 20
Type : Bearish
Timeframe : Daily
Bearish price crossover with Moving Average 50
Type : Bearish
Timeframe : Daily
Bearish price crossover with adaptative moving average 20
Type : Bearish
Timeframe : Daily
Bearish price crossover with adaptative moving average 100
Type : Bearish
Timeframe : Daily
An assessment of technical indicators shows a slightly bearish signal.
Caution: the Central Indicators scanner currently detects an excess:
Williams %R indicator is oversold : under -80
Type : Neutral
Timeframe : Daily
Pivot points : price is over resistance 1
Type : Neutral
Timeframe : Daily
MACD crosses DOWN its Moving Average
Type : Bearish
Timeframe : Daily
SuperTrend indicator bearish reversal
Type : Bearish
Timeframe : Daily
Price is back under the pivot point
Type : Bearish
Timeframe : Daily
Price is back under the pivot point
Type : Bearish
Timeframe : Weekly
Momentum indicator is back under 0
Type : Bearish
Timeframe : Daily
The Central Patterns scanner, which studies chart patterns, resistances and supports, has identified these signals:
Near support of triangle
Type : Bullish
Timeframe : Daily
Support of channel is broken
Type : Bearish
Timeframe : Daily
The Central Candlesticks scanner which studies Japanese candlesticks did not detect anything.
| S3 | S2 | S1 | Price | R1 | R2 | |
|---|---|---|---|---|---|---|
| ProTrendLines | 24.82 | 29.97 | 35.12 | 37.03 | 38.69 | 40.90 |
| Change (%) | -32.97% | -19.07% | -5.16% | - | +4.48% | +10.45% |
| Change | -12.21 | -7.06 | -1.91 | - | +1.66 | +3.87 |
| Level | Intermediate | Intermediate | Major | - | Intermediate | Major |
To determine price objectives, it is also possible to use the pivot points. Here is the price position in relation to pivot points:
| Pivot points | S3 | S2 | S1 | PP | R1 | R2 | R3 |
|---|---|---|---|---|---|---|---|
| Standard | 32.65 | 33.97 | 34.83 | 36.15 | 37.01 | 38.33 | 39.19 |
| Camarilla | 35.10 | 35.30 | 35.50 | 35.70 | 35.90 | 36.10 | 36.30 |
| Woodie | 32.43 | 33.86 | 34.61 | 36.04 | 36.79 | 38.22 | 38.97 |
| Fibonacci | 33.97 | 34.80 | 35.31 | 36.15 | 36.98 | 37.49 | 38.33 |
| Pivot points | S3 | S2 | S1 | PP | R1 | R2 | R3 |
|---|---|---|---|---|---|---|---|
| Standard | 32.83 | 34.90 | 36.37 | 38.44 | 39.91 | 41.98 | 43.45 |
| Camarilla | 36.88 | 37.20 | 37.53 | 37.85 | 38.17 | 38.50 | 38.82 |
| Woodie | 32.54 | 34.75 | 36.08 | 38.29 | 39.62 | 41.83 | 43.16 |
| Fibonacci | 34.90 | 36.25 | 37.08 | 38.44 | 39.79 | 40.62 | 41.98 |
| Pivot points | S3 | S2 | S1 | PP | R1 | R2 | R3 |
|---|---|---|---|---|---|---|---|
| Standard | 28.10 | 30.89 | 34.91 | 37.70 | 41.72 | 44.51 | 48.53 |
| Camarilla | 37.05 | 37.67 | 38.30 | 38.92 | 39.54 | 40.17 | 40.79 |
| Woodie | 28.71 | 31.20 | 35.52 | 38.01 | 42.33 | 44.82 | 49.14 |
| Fibonacci | 30.89 | 33.50 | 35.10 | 37.70 | 40.31 | 41.91 | 44.51 |
Numerical data
The following is the status of the technical indicators and moving averages at the time of publication of this technical analysis:
| RSI (14): | 46.08 | |
| MACD (12,26,9): | 0.0800 | |
| Directional Movement: | -11.67 | |
| AROON (14): | -35.71 | |
| DEMA (21): | 38.09 | |
| Parabolic SAR (0,02-0,02-0,2): | 40.22 | |
| Elder Ray (13): | -1.88 | |
| Super Trend (3,10): | 40.93 | |
| Zig ZAG (10): | 37.03 | |
| VORTEX (21): | 0.9700 | |
| Stochastique (14,3,5): | 29.54 | |
| TEMA (21): | 38.14 | |
| Williams %R (14): | -63.67 | |
| Chande Momentum Oscillator (20): | -0.87 | |
| Repulse (5,40,3): | -0.4000 | |
| ROCnROLL: | 2 | |
| TRIX (15,9): | 0.1100 | |
| Courbe Coppock: | 10.46 |
| MA7: | 38.37 | |
| MA20: | 37.65 | |
| MA50: | 37.66 | |
| MA100: | 38.11 | |
| MAexp7: | 37.77 | |
| MAexp20: | 37.95 | |
| MAexp50: | 37.70 | |
| MAexp100: | 36.60 | |
| Price / MA7: | -3.49% | |
| Price / MA20: | -1.65% | |
| Price / MA50: | -1.67% | |
| Price / MA100: | -2.83% | |
| Price / MAexp7: | -1.96% | |
| Price / MAexp20: | -2.42% | |
| Price / MAexp50: | -1.78% | |
| Price / MAexp100: | +1.17% |
News
Don"t forget to follow the news on AUDENTES THERAPEUTICS INC.. At the time of publication of this analysis, the latest news was as follows:
- Audentes Therapeutics Reports Second Quarter 2019 Financial Results and Provides Corporate Update
- Audentes Therapeutics to Participate in Upcoming Investor Conferences
- Audentes Therapeutics to Release Second Quarter 2019 Financial Results and Provide Corporate Update on Tuesday, August 6, 2019
- Audentes Therapeutics Announces Inducement Grants Under Nasdaq Listing Rule 5635(c)(4)
- Audentes Therapeutics Announces Inducement Grants Under Nasdaq Listing Rule 5635(c)(4)
About author

Online


Add a comment
Comments
0 comments on the analysis AUDENTES THERAPEUTICS INC. - Daily